Technical Analysis of GII 2024-05-10
Overview:
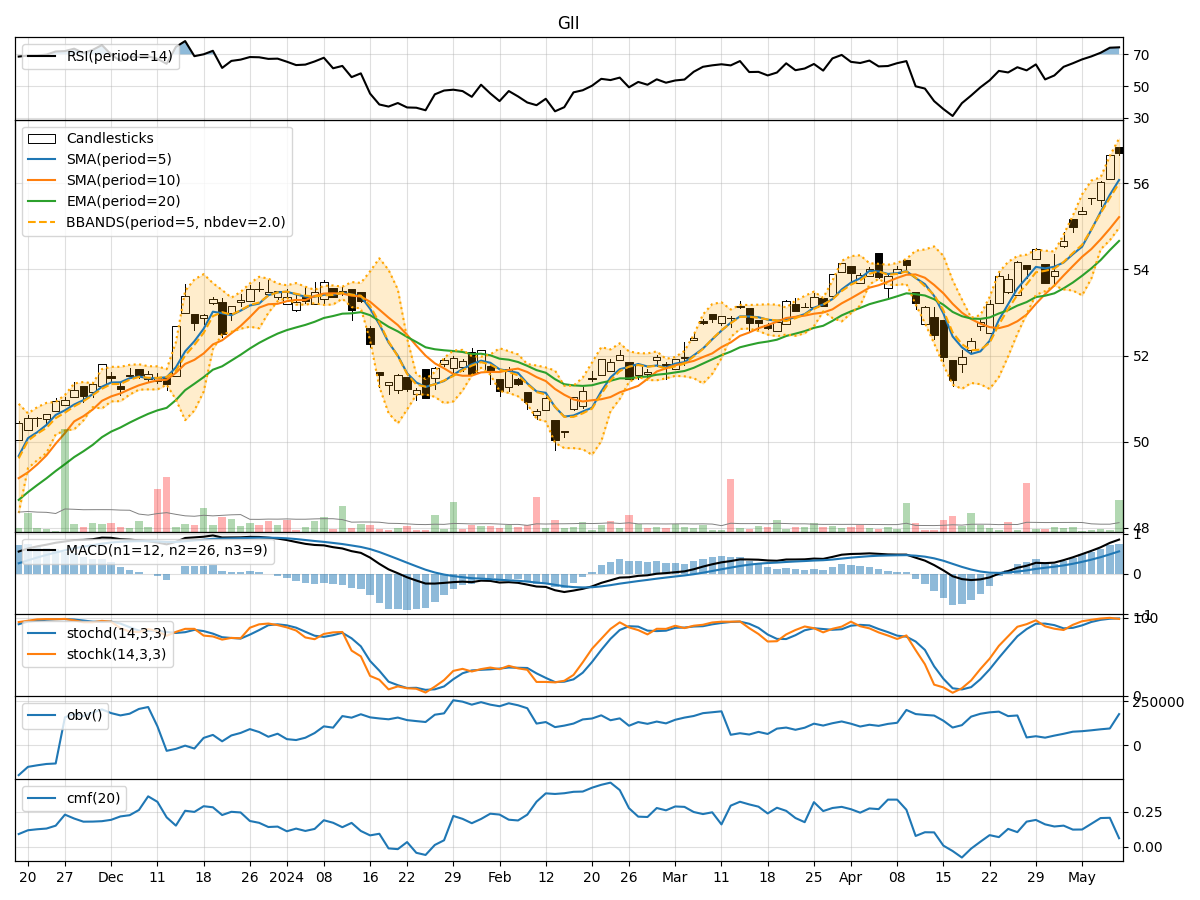
In analyzing the technical indicators for GII over the last 5 days, we will delve into the trend, momentum, volatility, and volume indicators to provide a comprehensive outlook on the possible stock price movement in the coming days. By examining these key aspects, we aim to offer valuable insights and recommendations for potential investors.
Trend Analysis:
- Moving Averages (MA): The 5-day MA has been consistently above the closing prices, indicating an upward trend.
- MACD: The MACD line has been above the signal line, suggesting bullish momentum.
Key Observation: The trend indicators point towards a bullish sentiment in the stock's price movement.
Momentum Analysis:
- RSI: The RSI values have been increasing, reaching overbought levels, indicating strong buying momentum.
- Stochastic Oscillator: Both %K and %D have been in the overbought zone, signaling potential price strength.
Key Observation: Momentum indicators reflect a strong bullish momentum in the stock.
Volatility Analysis:
- Bollinger Bands (BB): The stock price has been consistently trading above the middle band, indicating an uptrend.
Key Observation: Volatility indicators suggest a stable bullish trend in the stock price.
Volume Analysis:
- On-Balance Volume (OBV): The OBV has been decreasing, indicating a divergence between price and volume.
- Chaikin Money Flow (CMF): The CMF has been positive, suggesting buying pressure in the stock.
Key Observation: Volume indicators show a mixed signal with a divergence between OBV and CMF.
Conclusion:
Based on the analysis of trend, momentum, volatility, and volume indicators, the overall outlook for GII stock is strongly bullish. The trend is upward, supported by bullish momentum and stable volatility. However, the divergence in volume indicators warrants caution as it may indicate a potential reversal or consolidation in the near term.
Recommendation:
Considering the bullish sentiment in the technical indicators, investors may consider buying GII stock for potential short to medium-term gains. It is advisable to monitor the volume closely for any signs of reversal or consolidation in the price movement. As always, risk management and thorough analysis are crucial in making informed investment decisions.