Technical Analysis of GINX 2024-05-10
Overview:
In analyzing the technical indicators for GINX over the last 5 days, we will delve into the trends, momentum, volatility, and volume indicators to provide a comprehensive outlook on the possible stock price movement in the coming days. By examining these key aspects, we aim to offer valuable insights and predictions to guide your investment decisions.
Trend Analysis:
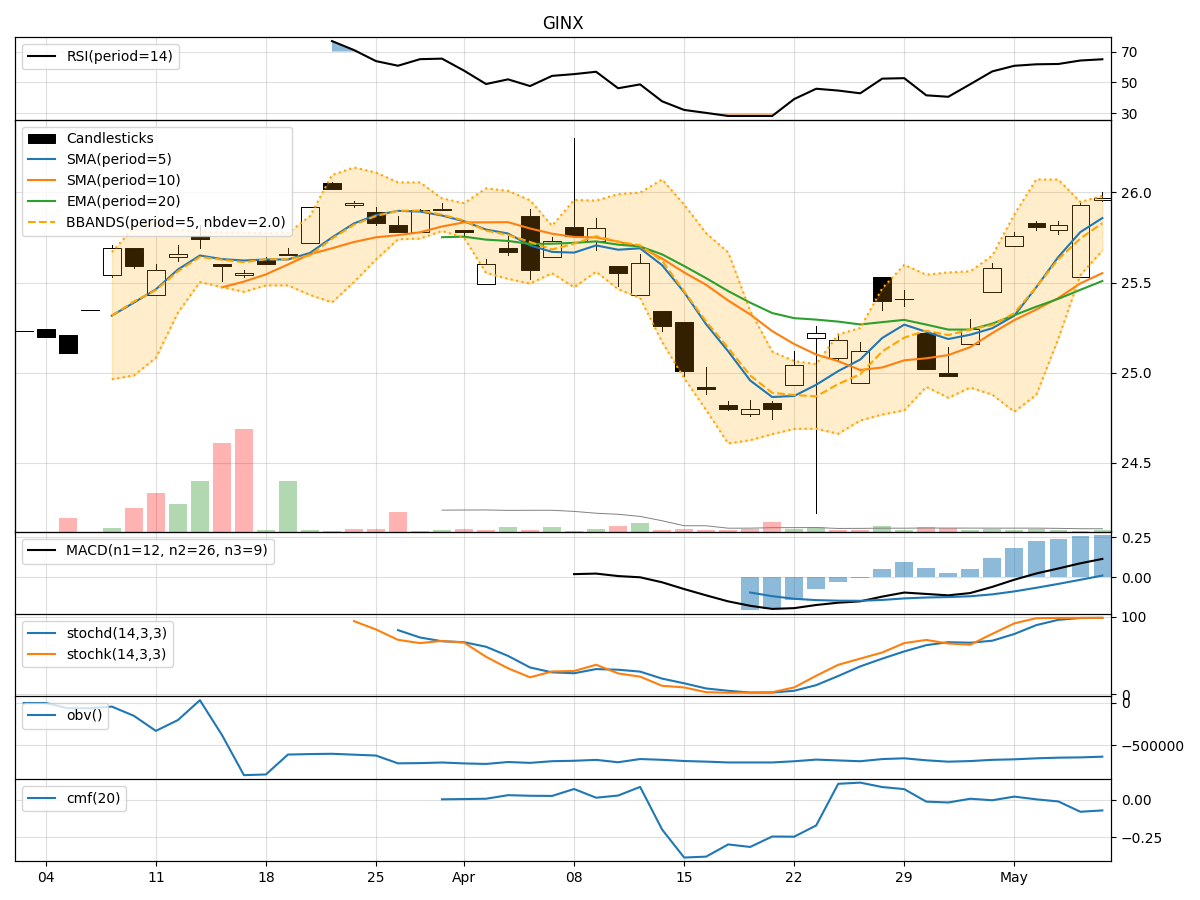
- Moving Averages (MA): The 5-day Moving Average has been consistently above the Simple Moving Average (SMA) and Exponential Moving Average (EMA), indicating a bullish trend.
- MACD: The MACD line has been consistently above the signal line, with both lines showing an upward trend, suggesting bullish momentum.
- MACD Histogram: The MACD Histogram has been increasing over the past 5 days, indicating strengthening bullish momentum.
Momentum Analysis:
- RSI: The Relative Strength Index (RSI) has been gradually increasing and is currently in the overbought territory, suggesting a potential pullback.
- Stochastic Oscillator: Both %K and %D lines of the Stochastic Oscillator are in the overbought zone, indicating a possible reversal.
- Williams %R: The Williams %R is also in the overbought region, signaling a potential downward movement.
Volatility Analysis:
- Bollinger Bands: The stock price has been trading within the Bollinger Bands, with the bands narrowing, indicating decreasing volatility.
- Bollinger %B: The %B indicator is above 0.8, suggesting that the stock is trading near the upper band, potentially indicating an overbought condition.
Volume Analysis:
- On-Balance Volume (OBV): The OBV has been declining over the last 5 days, indicating selling pressure in the stock.
- Chaikin Money Flow (CMF): The CMF has been negative, reflecting a bearish money flow into the stock.
Conclusion:
Based on the analysis of the technical indicators, the stock of GINX is currently exhibiting overbought conditions in terms of momentum indicators like RSI, Stochastic Oscillator, and Williams %R. The trend indicators, including Moving Averages and MACD, suggest a bullish trend in the short term. However, the declining OBV and negative CMF indicate selling pressure and bearish sentiment in the market.
Considering the overall picture, there is a possibility of a short-term pullback or consolidation in the stock price of GINX. Traders should exercise caution and consider waiting for a better entry point before initiating new long positions. It is advisable to monitor the price action closely and wait for confirmation of a new trend direction before making significant trading decisions.
Key Takeaways:
- Trend: Bullish in the short term.
- Momentum: Overbought conditions, signaling a potential reversal.
- Volatility: Decreasing volatility, potential consolidation.
- Volume: Selling pressure evident, bearish money flow.
Recommendation:
Exercise caution and consider waiting for a better entry point before considering long positions. Monitor price action closely for confirmation of a new trend direction.