Technical Analysis of GJAN 2024-05-10
Overview:
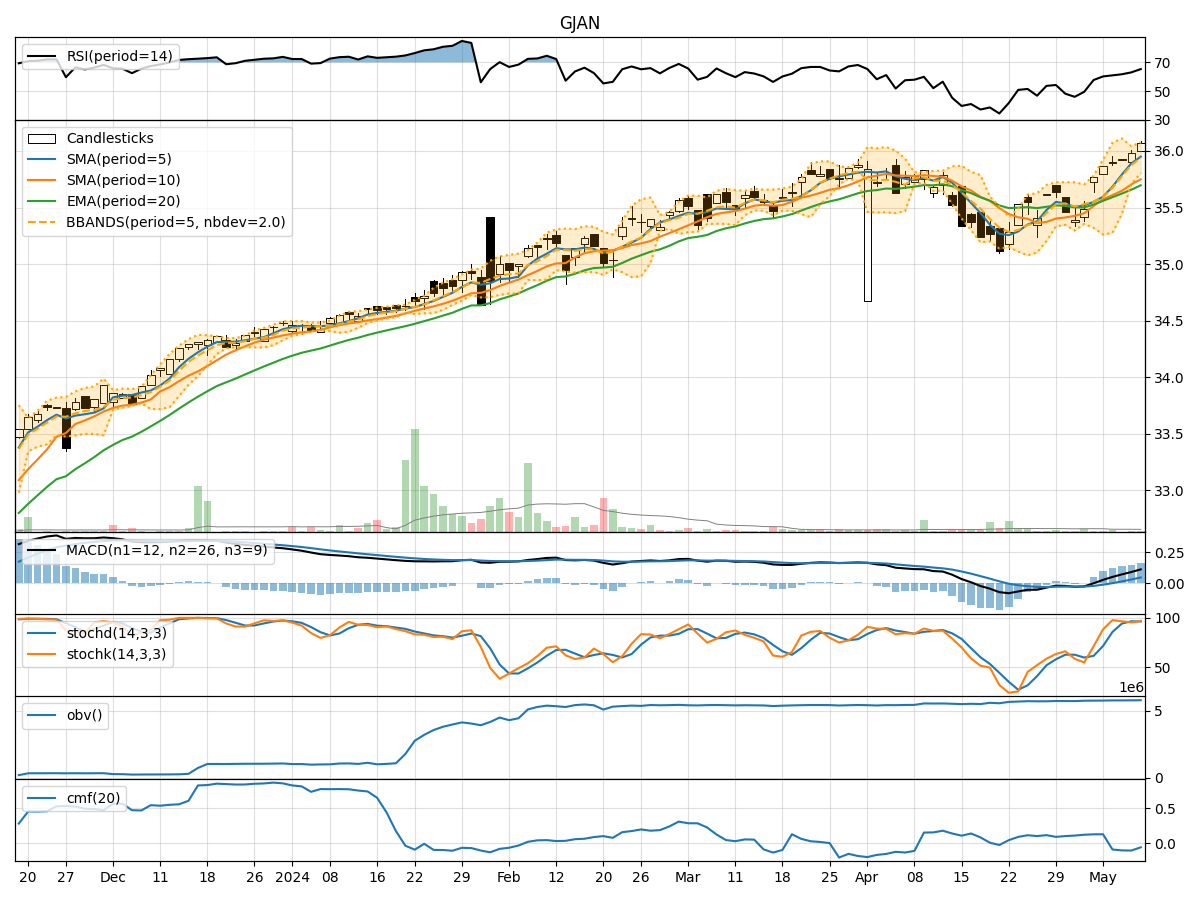
In analyzing the technical indicators for GJAN stock over the last 5 days, we will delve into the trends, momentum, volatility, and volume aspects to provide a comprehensive outlook on the possible stock price movement in the coming days.
Trend Analysis:
- Moving Averages (MA): The 5-day Moving Average (MA) has been consistently rising, indicating an upward trend in the stock price.
- MACD: The Moving Average Convergence Divergence (MACD) has shown positive values, suggesting bullish momentum.
- EMA: The Exponential Moving Average (EMA) has been trending upwards, supporting the bullish sentiment.
Momentum Analysis:
- RSI: The Relative Strength Index (RSI) has been increasing, indicating strengthening momentum.
- Stochastic Oscillator: Both %K and %D values have been high, signaling strong buying pressure.
- Williams %R: The Williams %R is in the oversold region, suggesting a potential reversal.
Volatility Analysis:
- Bollinger Bands: The Bollinger Bands have been narrowing, indicating decreasing volatility.
- Bollinger %B: The %B value has been increasing, suggesting a potential breakout.
Volume Analysis:
- On-Balance Volume (OBV): The OBV has been steadily increasing, reflecting accumulation by investors.
- Chaikin Money Flow (CMF): The CMF has been negative, indicating some selling pressure.
Key Observations:
- The stock is in an upward trend based on moving averages and MACD.
- Momentum indicators suggest strong buying pressure and potential for a reversal according to Williams %R.
- Volatility is decreasing, potentially leading to a breakout.
- Volume indicators show accumulation but also some selling pressure based on CMF.
Conclusion:
Based on the analysis of technical indicators, the next few days for GJAN stock are likely to see a continuation of the upward trend with strong buying pressure and a potential breakout due to decreasing volatility. Investors should consider buying opportunities in the stock.