Technical Analysis of GLDI 2024-05-10
Overview:
In analyzing the technical indicators for GLDI over the last 5 days, we will delve into the trend, momentum, volatility, and volume indicators to provide a comprehensive outlook on the possible stock price movement in the coming days.
Trend Analysis:
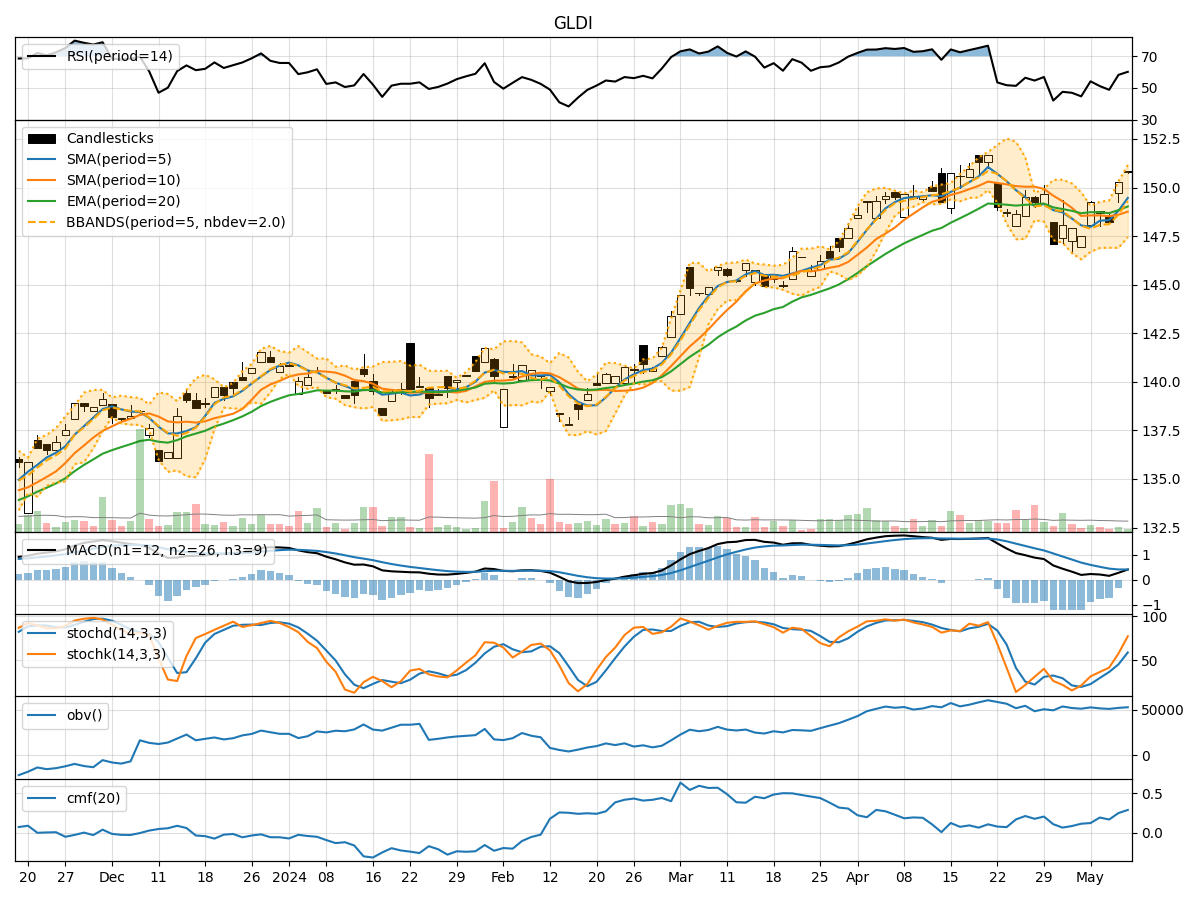
- Moving Averages (MA): The 5-day Moving Average (MA) has been consistently above the Simple Moving Average (SMA) and Exponential Moving Average (EMA), indicating a short-term bullish trend.
- MACD: The MACD line has been positive, with the MACD Histogram showing a slight decrease but still above the signal line, suggesting a continuation of the bullish momentum.
Momentum Analysis:
- RSI: The Relative Strength Index (RSI) has been fluctuating around the neutral zone, indicating indecision in the market.
- Stochastic Oscillator: Both %K and %D have been in the overbought territory, suggesting a potential reversal or consolidation phase.
- Williams %R: The Williams %R is hovering around the oversold region, signaling a possible buying opportunity.
Volatility Analysis:
- Bollinger Bands (BB): The stock price has been trading within the Bollinger Bands, with the bands widening slightly, indicating increased volatility.
- Bollinger %B: The %B indicator has been fluctuating within the bands, suggesting potential price reversals.
Volume Analysis:
- On-Balance Volume (OBV): The OBV has shown a slight increase, indicating accumulation by investors.
- Chaikin Money Flow (CMF): The CMF has been positive, reflecting buying pressure in the market.
Key Observations:
- The trend indicators suggest a bullish bias in the short term.
- Momentum indicators show mixed signals, with potential for a reversal or consolidation.
- Volatility has increased slightly, indicating potential price swings.
- Volume indicators point towards accumulation and buying pressure.
Conclusion:
Based on the analysis of the technical indicators, the stock price of GLDI is likely to experience further upward movement in the coming days. The bullish trend supported by moving averages and MACD, coupled with positive volume indicators, indicates a favorable outlook. However, caution is advised due to mixed signals from momentum indicators, which suggest a possible consolidation or reversal. Traders should closely monitor price action and key support/resistance levels for timely decision-making.
Recommendation:
- Short-term Traders: Consider taking long positions with tight stop-loss levels to capitalize on the bullish momentum.
- Long-term Investors: Monitor the price action for potential entry points or wait for more clarity in the market direction before making significant investment decisions.
Remember to conduct further analysis and stay updated on market developments to adapt your trading strategy accordingly.