Technical Analysis of GLIN 2024-05-10
Overview:
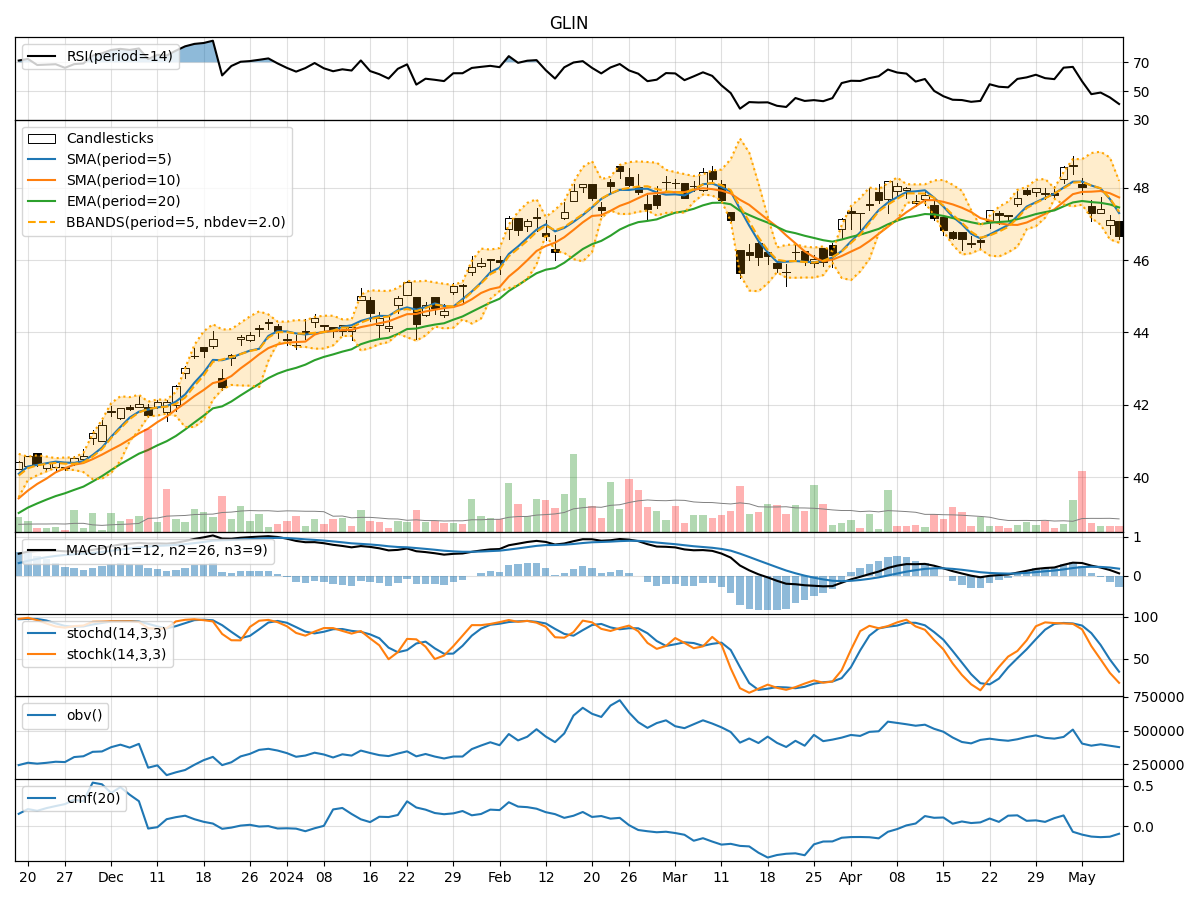
In analyzing the technical indicators for GLIN over the last 5 days, we will delve into the trend, momentum, volatility, and volume indicators to provide a comprehensive outlook on the possible stock price movement in the coming days.
Trend Indicators:
- Moving Averages (MA): The 5-day MA has been gradually decreasing, indicating a short-term bearish trend.
- MACD: The MACD line has been consistently positive, but the MACD Histogram has been decreasing, suggesting a potential weakening of the bullish momentum.
- EMA: The EMA has been declining, further supporting the bearish sentiment.
Momentum Indicators:
- RSI: The RSI has been decreasing, indicating a loss of bullish momentum.
- Stochastic Oscillator: Both %K and %D have been declining, signaling a potential shift towards oversold conditions.
- Williams %R: The indicator has been moving deeper into oversold territory, reflecting increased selling pressure.
Volatility Indicators:
- Bollinger Bands (BB): The stock price has been trading below the middle Bollinger Band, suggesting a bearish sentiment.
- Bollinger %B: The %B indicator has been decreasing, indicating a potential downtrend continuation.
Volume Indicators:
- On-Balance Volume (OBV): The OBV has been negative, indicating distribution and selling pressure.
- Chaikin Money Flow (CMF): The CMF has been consistently negative, reflecting a lack of buying interest.
Key Observations and Opinions:
- Trend: The trend indicators suggest a bearish sentiment in the short term.
- Momentum: Momentum indicators point towards increasing selling pressure and a potential oversold condition.
- Volatility: Volatility indicators support the bearish outlook with the stock trading below the middle Bollinger Band.
- Volume: Volume indicators confirm the bearish sentiment with negative OBV and CMF values.
Conclusion:
Based on the analysis of the technical indicators, the next few days' possible stock price movement for GLIN is likely to continue downwards. The overall trend, momentum, volatility, and volume indicators all point towards a bearish outlook. Traders and investors should exercise caution and consider shorting or staying on the sidelines until a clear reversal pattern emerges.