Technical Analysis of GLL 2024-05-10
Overview:
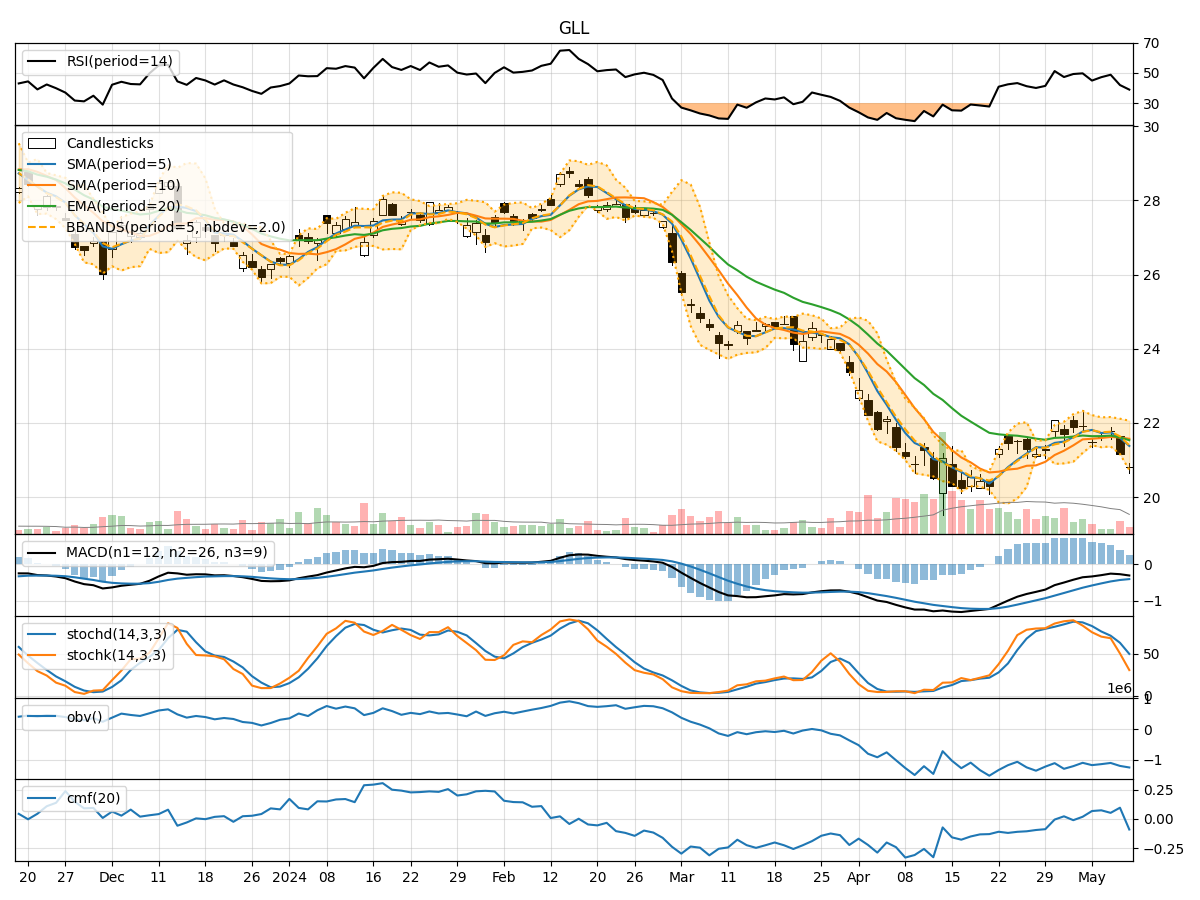
In analyzing the technical indicators for GLL over the last 5 days, we will delve into the trend, momentum, volatility, and volume indicators to provide a comprehensive outlook on the possible stock price movement in the coming days. By examining these key indicators, we aim to offer valuable insights and recommendations for potential investors.
Trend Analysis:
- Moving Averages (MA): The 5-day Moving Average (MA) has been declining steadily, indicating a short-term bearish trend.
- MACD: The Moving Average Convergence Divergence (MACD) has been negative, suggesting a bearish momentum in the stock price.
- EMA: The Exponential Moving Average (EMA) has also been trending downwards, aligning with the bearish sentiment in the short term.
Momentum Analysis:
- RSI: The Relative Strength Index (RSI) has been decreasing, indicating a weakening momentum in the stock price.
- Stochastic Oscillator: Both %K and %D of the Stochastic Oscillator have been declining, signaling a bearish momentum.
- Williams %R: The Williams %R is in oversold territory, suggesting a potential reversal or continuation of the downtrend.
Volatility Analysis:
- Bollinger Bands: The Bollinger Bands have been widening, indicating increased volatility in the stock price.
- Bollinger %B: The %B indicator is below 1, suggesting that the stock price is trading below the lower Bollinger Band, which may indicate an oversold condition.
Volume Analysis:
- On-Balance Volume (OBV): The OBV has been decreasing, indicating selling pressure in the stock.
- Chaikin Money Flow (CMF): The CMF has been positive but decreasing, suggesting a potential outflow of money from the stock.
Conclusion:
Based on the analysis of the technical indicators, the overall outlook for GLL in the next few days is bearish. The trend indicators, momentum indicators, and volume indicators all point towards a continuation of the downward trend in the stock price. The increasing volatility, coupled with the oversold conditions indicated by the Williams %R and %B, further support the bearish view.
Recommendation:
Considering the bearish signals from multiple technical indicators, it is advisable to exercise caution when considering investments in GLL in the near term. Traders may look for short-selling opportunities or wait for a potential reversal confirmation before considering long positions. It is essential to monitor the price action closely and wait for more definitive signals before making any significant trading decisions.