Technical Analysis of GLOF 2024-05-10
Overview:
In analyzing the technical indicators for GLOF stock over the last 5 days, we will delve into the trend, momentum, volatility, and volume indicators to provide a comprehensive outlook on the possible stock price movement in the upcoming days. By examining these key indicators, we aim to offer valuable insights and predictions to guide your investment decisions.
Trend Indicators:
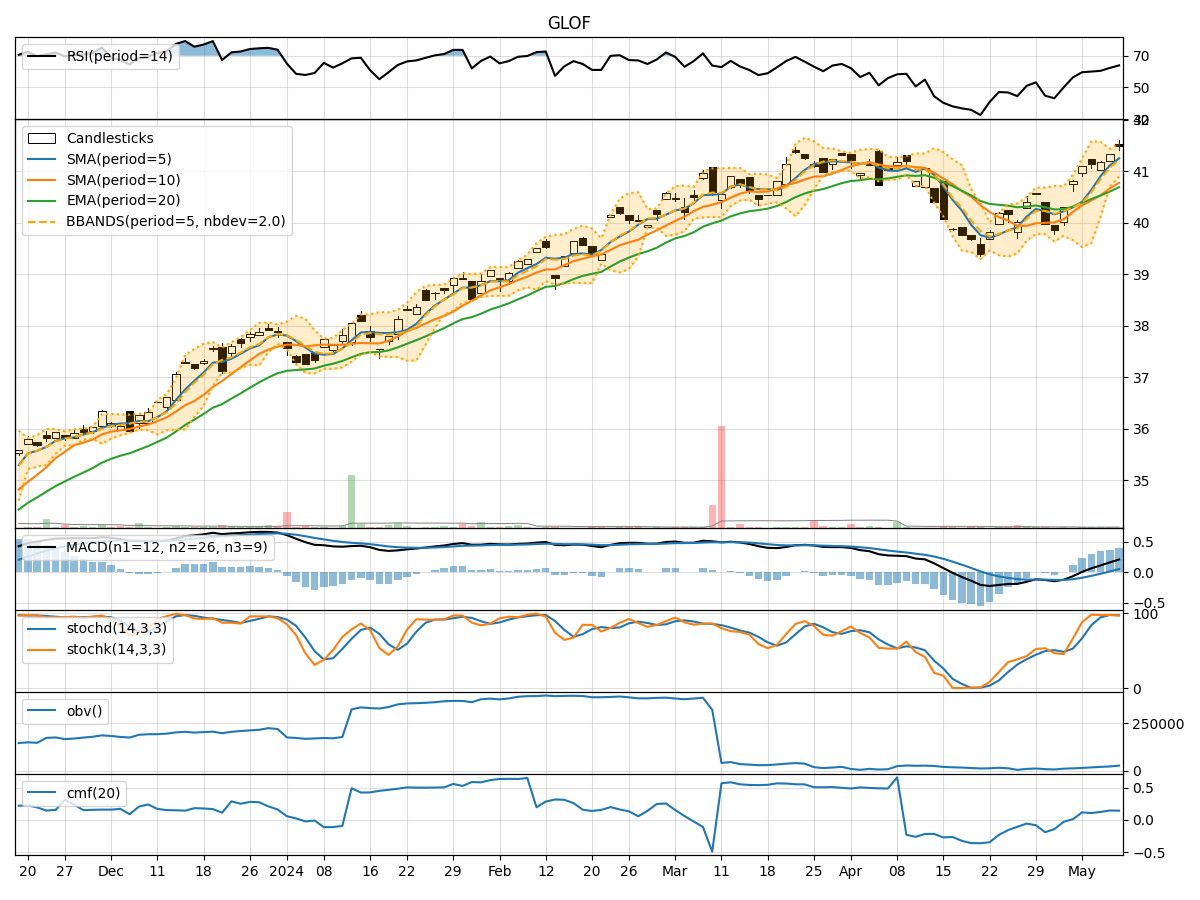
- Moving Averages (MA): The 5-day Moving Average (MA) has been consistently trending upwards, indicating a positive momentum in the stock price.
- MACD: The MACD line has been steadily increasing, showing a bullish trend in the stock.
- MACD Histogram: The MACD Histogram has been rising, suggesting a strengthening bullish momentum.
Momentum Indicators:
- RSI: The Relative Strength Index (RSI) has been increasing, indicating a growing bullish momentum in the stock.
- Stochastic Oscillator: Both %K and %D lines of the Stochastic Oscillator are high, signaling an overbought condition.
- Williams %R: The Williams %R is in the oversold territory, suggesting a potential reversal in the stock price.
Volatility Indicators:
- Bollinger Bands: The Bollinger Bands are narrowing, indicating decreasing volatility in the stock price.
- Bollinger %B: The %B indicator is above 0.8, suggesting the stock is trading near the upper Bollinger Band.
Volume Indicators:
- On-Balance Volume (OBV): The OBV has been decreasing, indicating a potential distribution phase in the stock.
- Chaikin Money Flow (CMF): The CMF is positive, suggesting buying pressure in the stock.
Key Observations and Opinions:
- Trend: The stock is in an upward trend based on moving averages and MACD indicators.
- Momentum: The momentum indicators suggest a bullish sentiment but also show signs of overbought conditions.
- Volatility: Volatility is decreasing, indicating a possible period of consolidation.
- Volume: The decreasing OBV suggests some profit-taking, while the positive CMF indicates buying interest.
Conclusion:
Based on the analysis of the technical indicators, the next few days for GLOF stock are likely to see further upward movement in the stock price. However, caution is advised due to the overbought conditions indicated by the Stochastic Oscillator and the potential for a reversal highlighted by the Williams %R indicator. Investors should closely monitor the price action and consider taking profits or implementing risk management strategies to navigate the market dynamics effectively.