Technical Analysis of GLOV 2024-05-10
Overview:
In analyzing the technical indicators for GLOV over the last 5 days, we will delve into the trend, momentum, volatility, and volume indicators to provide a comprehensive outlook on the possible stock price movement in the coming days. By examining these key indicators, we aim to offer valuable insights and predictions for informed decision-making.
Trend Analysis:
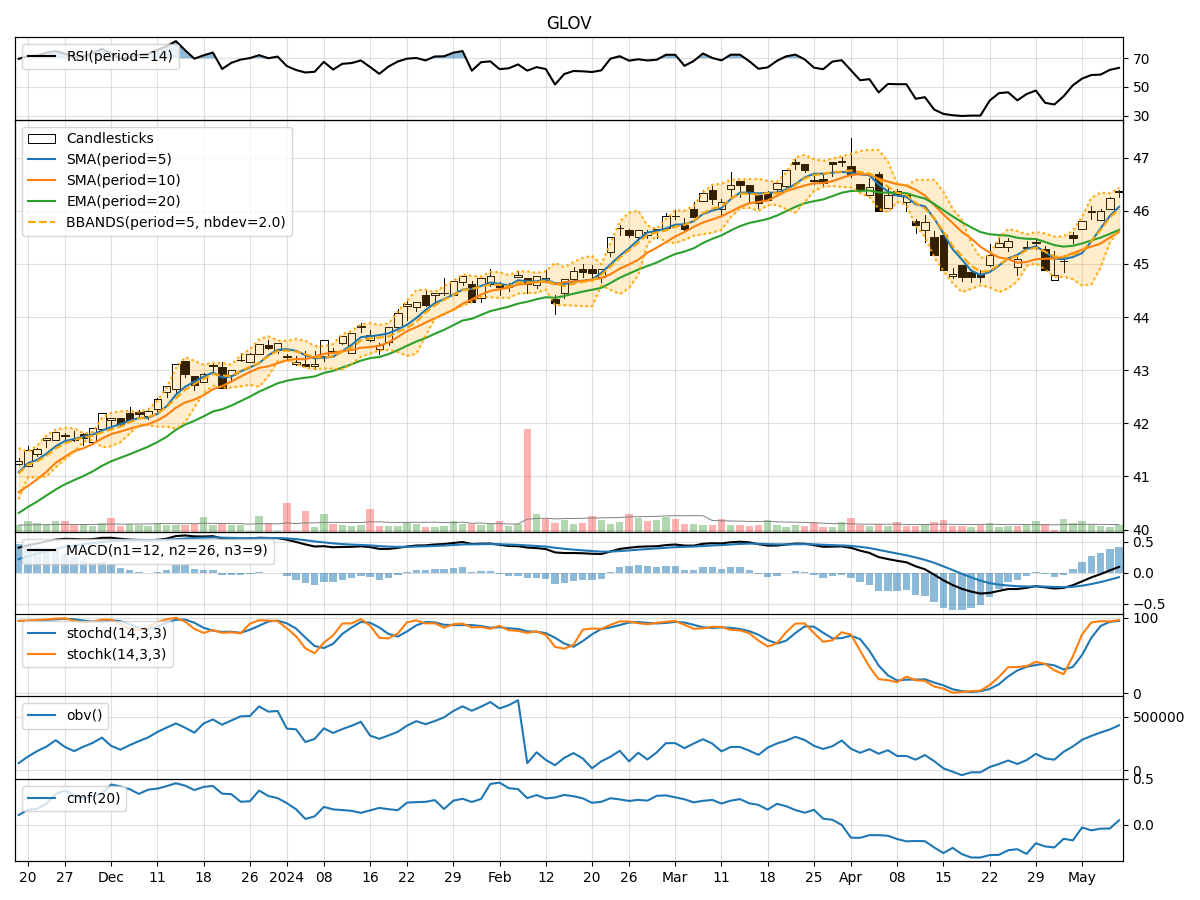
- Moving Averages (MA): The 5-day Moving Average (MA) has been consistently trending upwards, indicating a positive momentum in the stock price.
- MACD: The Moving Average Convergence Divergence (MACD) has shown a positive trend with the MACD line consistently above the signal line, suggesting bullish momentum.
- EMA: The Exponential Moving Average (EMA) has been steadily increasing, further supporting the bullish trend in the stock price.
Momentum Analysis:
- RSI: The Relative Strength Index (RSI) has been trending upwards, indicating increasing buying pressure and potential overbought conditions.
- Stochastic Oscillator: Both %K and %D lines of the Stochastic Oscillator are in the overbought zone, suggesting a potential reversal or consolidation.
- Williams %R: The Williams %R is in the oversold territory, indicating a possible buying opportunity in the near term.
Volatility Analysis:
- Bollinger Bands: The Bollinger Bands are narrowing, indicating decreasing volatility and a potential period of consolidation.
- Bollinger %B: The %B indicator is hovering around the midline, suggesting a balanced market sentiment with no extreme overbought or oversold conditions.
Volume Analysis:
- On-Balance Volume (OBV): The OBV indicator has been steadily increasing, reflecting positive volume flow and accumulation in the stock.
- Chaikin Money Flow (CMF): The CMF is negative but has shown signs of improvement, indicating a potential shift towards buying pressure.
Conclusion:
Based on the analysis of the technical indicators, the stock of GLOV is bullish in the short term. The trend indicators, momentum indicators, and volume indicators all point towards a continuation of the upward trend. However, the narrowing Bollinger Bands suggest a potential period of consolidation before the next leg up. Traders should consider buying on dips or wait for a breakout above the recent high for a confirmation of further upside potential.