Technical Analysis of GLRY 2024-05-10
Overview:
In analyzing the technical indicators for GLRY over the last 5 days, we will delve into the trend, momentum, volatility, and volume indicators to provide a comprehensive outlook on the possible stock price movement in the coming days.
Trend Analysis:
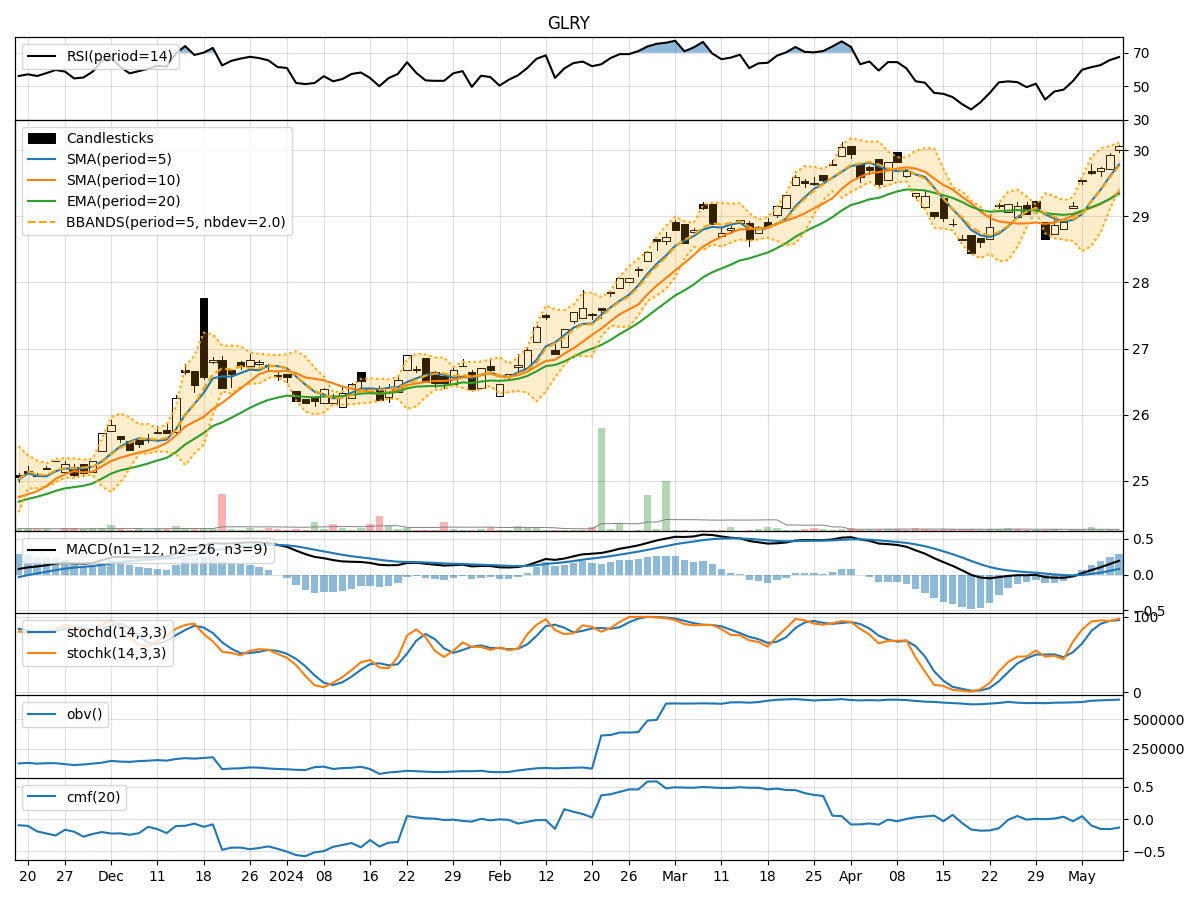
- Moving Averages (MA): The 5-day Moving Average has been consistently rising, indicating an upward trend in the stock price.
- MACD: The MACD line has been above the signal line for the past 5 days, suggesting a bullish momentum.
Key Observation: The trend indicators point towards a bullish sentiment in the stock price movement.
Momentum Analysis:
- RSI: The Relative Strength Index has been increasing, showing strengthening momentum.
- Stochastic Oscillator: Both %K and %D have been in the overbought zone, indicating a strong buying momentum.
Key Observation: Momentum indicators signal a strong bullish momentum in the stock.
Volatility Analysis:
- Bollinger Bands: The stock price has been consistently trading above the middle Bollinger Band, indicating an uptrend.
Key Observation: Volatility indicators suggest a bullish trend in the stock price.
Volume Analysis:
- On-Balance Volume (OBV): The OBV has been steadily increasing, reflecting accumulation by investors.
- Chaikin Money Flow (CMF): The CMF has been negative, indicating some selling pressure in the stock.
Key Observation: Volume indicators show a mixed sentiment with accumulation but some selling pressure.
Conclusion:
Based on the analysis of trend, momentum, volatility, and volume indicators, the overall outlook for GLRY is strongly bullish. The stock is likely to continue its upward trajectory in the coming days, driven by positive momentum and trend indicators. Traders and investors may consider buying opportunities in GLRY for potential short to medium-term gains.
Key Conclusion: GLRY is expected to experience further upward movement in the next few days.