Technical Analysis of GMET 2024-05-10
Overview:
In analyzing the technical indicators for GMET over the last 5 days, we will delve into the trend, momentum, volatility, and volume indicators to provide a comprehensive outlook on the possible stock price movement in the coming days. By examining these key aspects, we aim to offer valuable insights and predictions for potential investors.
Trend Analysis:
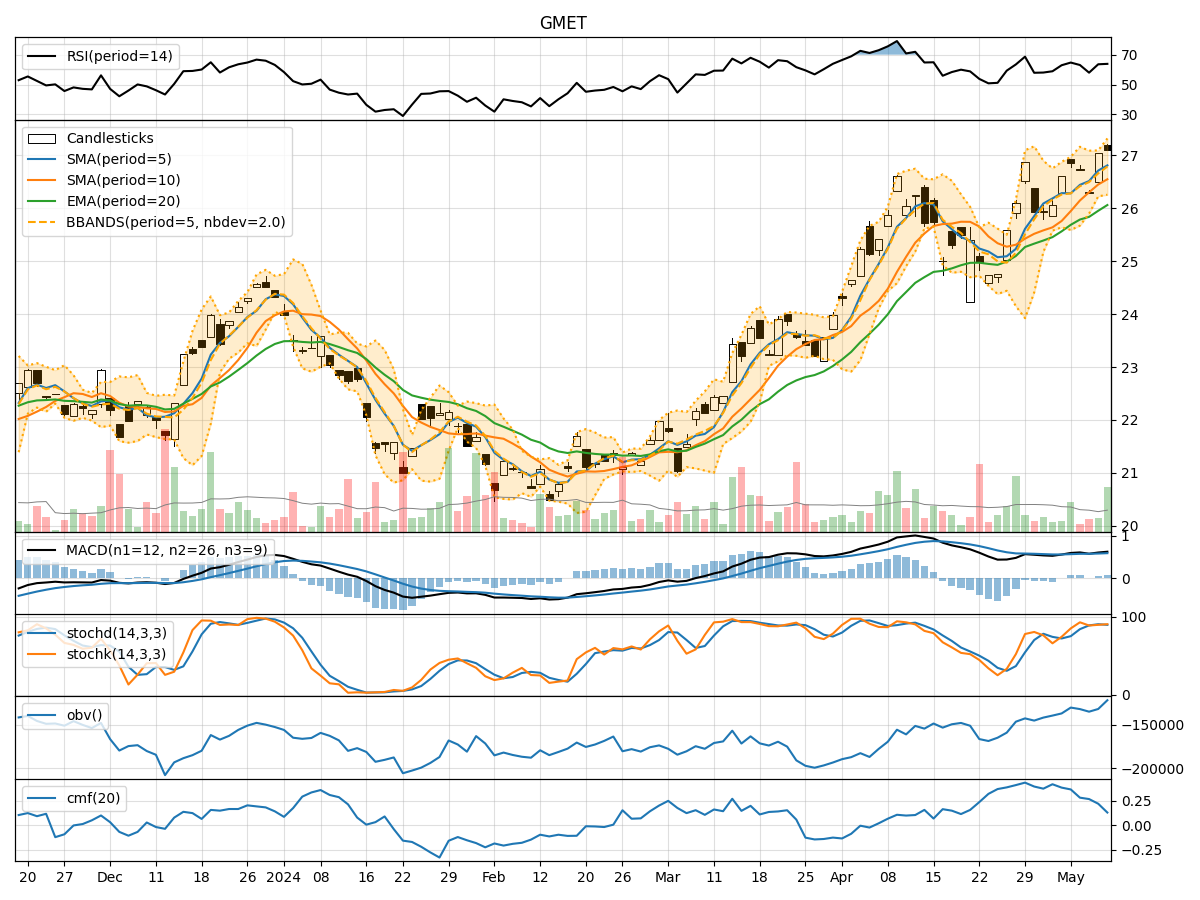
- Moving Averages (MA): The 5-day Moving Average (MA) has been consistently above the Simple Moving Average (SMA) and Exponential Moving Average (EMA), indicating a bullish trend.
- MACD: The MACD line has been positive, with the MACD Histogram also showing positive values, suggesting upward momentum in the stock price.
Momentum Analysis:
- RSI: The Relative Strength Index (RSI) has been fluctuating around the 60-70 range, indicating moderate momentum without being overbought or oversold.
- Stochastic Oscillator: Both %K and %D have been in the overbought territory, suggesting a potential reversal or consolidation phase.
Volatility Analysis:
- Bollinger Bands (BB): The stock price has been trading within the Bollinger Bands, with the %B indicator hovering around 0.7-0.8, indicating a moderate level of volatility.
Volume Analysis:
- On-Balance Volume (OBV): The OBV has shown a slight increase over the last few days, indicating some accumulation by investors.
- Chaikin Money Flow (CMF): The CMF has been positive but decreasing, suggesting a potential decrease in buying pressure.
Key Observations:
- The trend indicators point towards a bullish sentiment in the short term.
- Momentum indicators show a mixed signal with RSI indicating moderate momentum and Stochastic Oscillator signaling potential overbought conditions.
- Volatility remains moderate, with the stock price trading within the Bollinger Bands.
- Volume indicators suggest some accumulation but a decrease in buying pressure.
Conclusion:
Based on the analysis of the technical indicators, the stock price of GMET is likely to experience further upward movement in the next few days. However, caution is advised as the Stochastic Oscillator indicates potential overbought conditions, which could lead to a short-term pullback or consolidation. Investors should closely monitor the price action and key support/resistance levels for timely decision-making.
Recommendation:
- Short-term Traders: Consider taking profits as the stock approaches overbought levels.
- Long-term Investors: Hold positions with a watchful eye on key technical levels for potential entry or exit points.
In conclusion, while the overall outlook is bullish for GMET, it is essential to remain vigilant and adapt to changing market conditions to make informed investment decisions.