Technical Analysis of GMUN 2024-05-10
Overview:
In analyzing the technical indicators for GMUN over the last 5 days, we will delve into the trend, momentum, volatility, and volume indicators to provide a comprehensive outlook on the possible stock price movement in the coming days. By examining these key aspects, we aim to offer valuable insights and predictions for potential investors.
Trend Indicators:
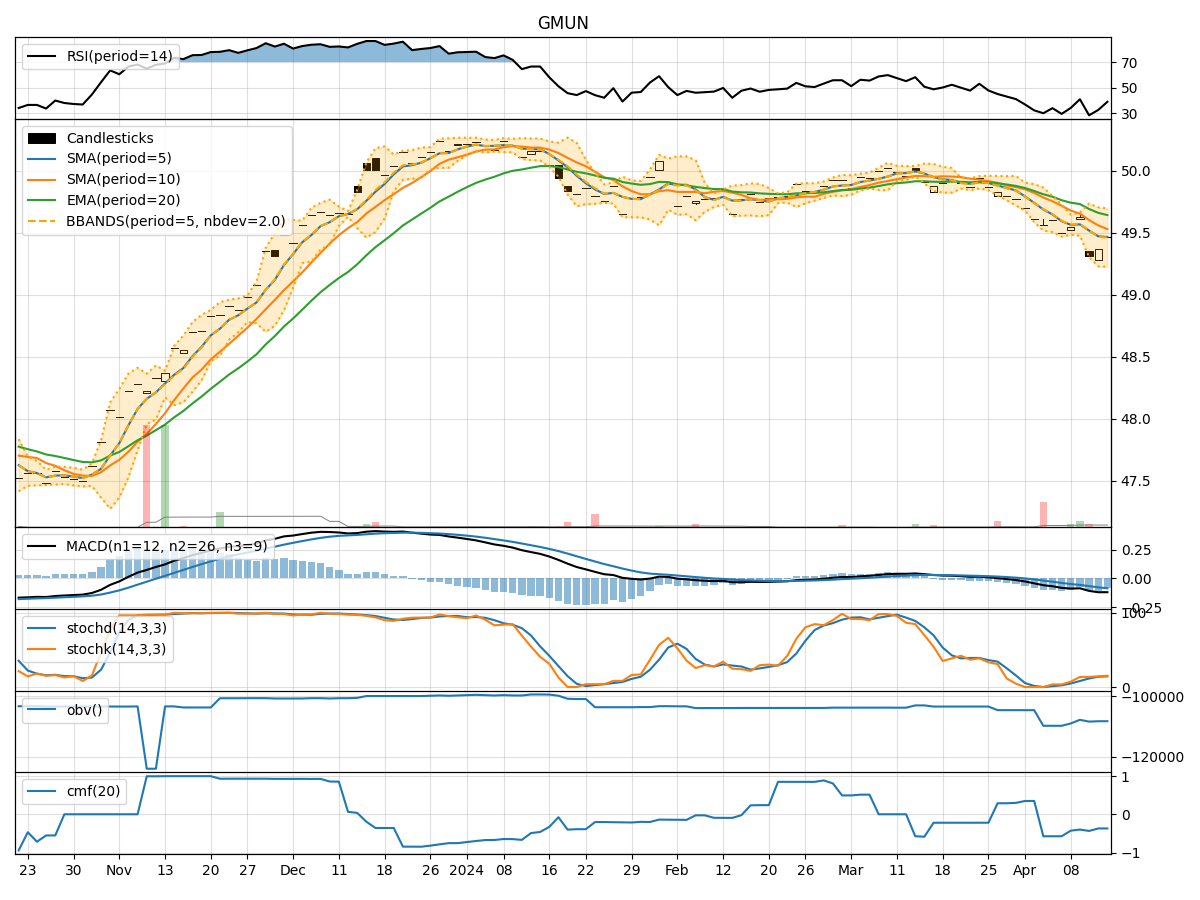
- Moving Averages (MA): The 5-day MA has been consistently above the 10-day SMA, indicating a short-term bullish trend.
- MACD: The MACD line has been positive, suggesting upward momentum in the stock price.
- MACD Histogram: The histogram has shown a slight decrease but remains above the zero line, indicating a potential consolidation phase.
Momentum Indicators:
- RSI: The RSI has been fluctuating around the 60 level, indicating a neutral momentum.
- Stochastic Oscillator: Both %K and %D have been in the overbought zone, suggesting a potential reversal or consolidation.
- Williams %R: The indicator has been in the oversold territory, signaling a possible bullish reversal.
Volatility Indicators:
- Bollinger Bands (BB): The stock price has been trading within the bands, with the %B indicator showing a slight decline towards the lower band.
- Volatility: The volatility has been decreasing, indicating a potential stabilization in price movements.
Volume Indicators:
- On-Balance Volume (OBV): The OBV has shown a slight decrease, suggesting some selling pressure.
- Chaikin Money Flow (CMF): The CMF has been positive, indicating buying pressure in the stock.
Key Observations:
- The trend indicators suggest a short-term bullish bias, supported by the positive MACD.
- Momentum indicators show mixed signals, with RSI neutral, Stochastic overbought, and Williams %R oversold.
- Volatility has been decreasing, indicating a potential consolidation phase.
- Volume indicators reflect a slight decrease in buying pressure but overall positive CMF.
Conclusion:
Based on the analysis of the technical indicators, the stock price of GMUN is likely to experience sideways movement in the coming days. The trend remains upward, supported by the moving averages and MACD, while momentum indicators suggest a potential consolidation or reversal. Volatility is expected to stabilize, and volume indicators point towards moderate buying pressure. Therefore, investors should exercise caution and closely monitor key levels for potential entry or exit points.
Recommendation:
- Short-term Traders: Consider taking profits or setting tight stop-loss orders due to the potential consolidation phase.
- Long-term Investors: Monitor the price action for a clearer trend direction before making significant investment decisions.
By carefully considering the interplay of these technical indicators, investors can make more informed decisions regarding their positions in GMUN.