Technical Analysis of GOCT 2024-05-10
Overview:
In analyzing the technical indicators for GOCT over the last 5 days, we will delve into the trend, momentum, volatility, and volume indicators to provide a comprehensive outlook on the possible stock price movement in the coming days. By examining these key indicators, we aim to offer valuable insights and predictions to guide your investment decisions.
Trend Analysis:
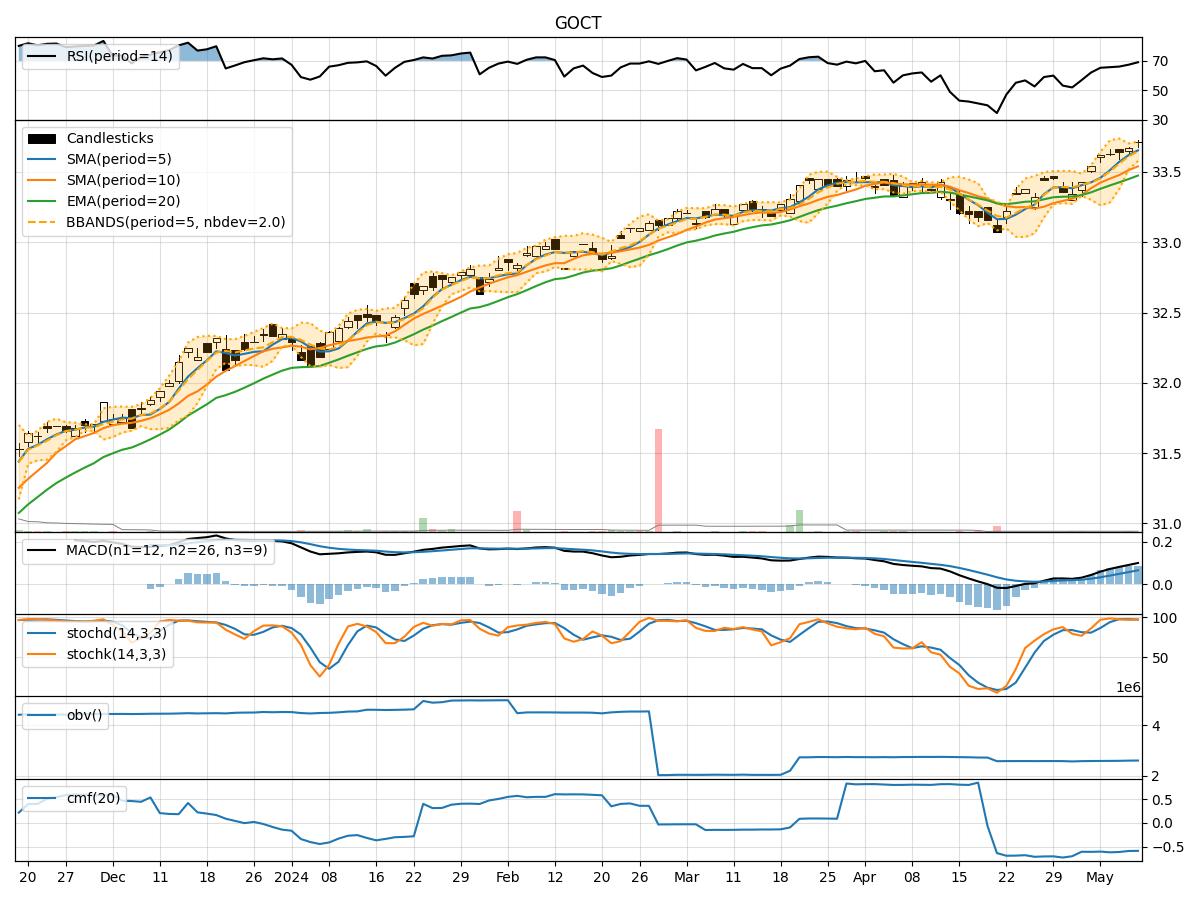
- Moving Averages (MA): The moving averages show a consistent uptrend over the last 5 days, with the closing price consistently above the short-term moving averages.
- MACD: The MACD line has been steadily increasing, indicating a strengthening bullish momentum.
- RSI: The RSI is in the overbought territory, suggesting a potential pullback or consolidation in the near future.
Momentum Analysis:
- Stochastic Oscillator: The stochastic indicators are in the overbought zone, signaling a potential reversal or correction.
- Williams %R (Willr): The Williams %R is also in the oversold region, indicating a possible bearish sentiment.
Volatility Analysis:
- Bollinger Bands (BB): The Bollinger Bands have been narrowing, indicating decreasing volatility and a potential breakout or significant price movement ahead.
Volume Analysis:
- On-Balance Volume (OBV): The OBV has been declining, suggesting a divergence between price and volume, which could lead to a reversal.
- Chaikin Money Flow (CMF): The CMF is negative, indicating selling pressure in the market.
Key Observations:
- The trend indicators suggest a bullish sentiment, supported by the MACD and moving averages.
- Momentum indicators, such as the RSI and stochastic oscillators, point towards a potential reversal or correction due to overbought conditions.
- Volatility indicators show a narrowing Bollinger Bands, hinting at an imminent breakout or significant price movement.
- Volume indicators indicate a divergence between price and volume, which could lead to a reversal in the stock price.
Conclusion:
Based on the analysis of the technical indicators, the stock price of GOCT is likely to experience a short-term correction or consolidation in the coming days. The overbought conditions in the momentum indicators and the narrowing Bollinger Bands suggest a potential reversal or pullback in the stock price. Traders and investors should exercise caution and consider taking profits or implementing risk management strategies in anticipation of a possible downward movement in the stock price.