Technical Analysis of GOEX 2024-05-10
Overview:
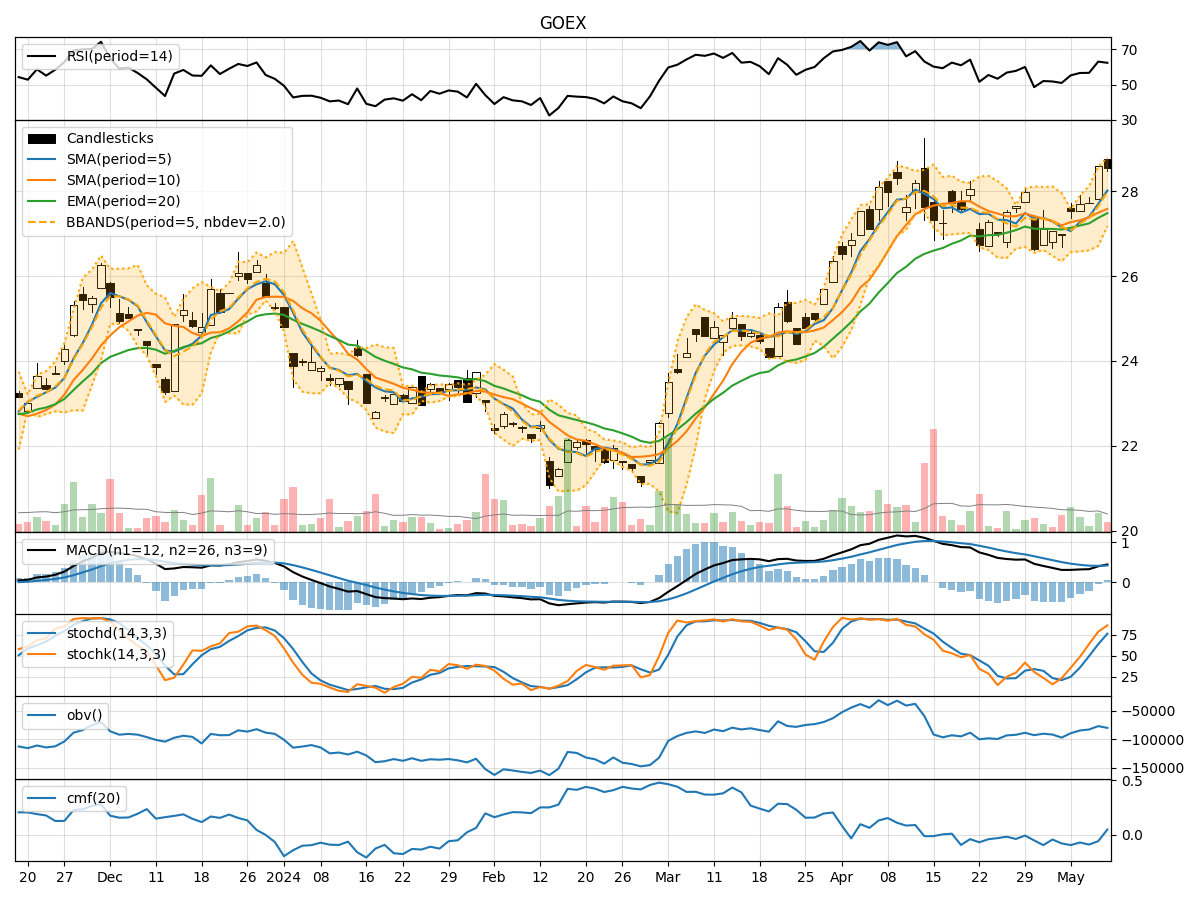
In analyzing the technical indicators for GOEX over the last 5 days, we will delve into the trend, momentum, volatility, and volume indicators to provide a comprehensive outlook on the possible stock price movement in the coming days. By examining key metrics such as moving averages, MACD, RSI, Bollinger Bands, and OBV, we aim to offer valuable insights and predictions for potential price action.
Trend Indicators:
- Moving Averages (MA): The 5-day MA has been consistently above the closing prices, indicating a short-term uptrend.
- MACD: The MACD line has been above the signal line, suggesting bullish momentum.
- MACD Histogram: The histogram has been increasing, indicating strengthening bullish momentum.
Momentum Indicators:
- RSI: The RSI has been trending upwards and is currently in the overbought territory, suggesting a potential pullback.
- Stochastic Oscillator: Both %K and %D have been in the overbought zone, indicating a possible reversal.
- Williams %R: The indicator is in the oversold region, signaling a potential buying opportunity.
Volatility Indicators:
- Bollinger Bands: The price has been trading near the upper band, indicating high volatility and a potential overbought condition.
- Bollinger %B: The %B is above 0.8, suggesting a potential reversal or correction.
- Bollinger Band Width: The band width has been expanding, indicating increased volatility.
Volume Indicators:
- On-Balance Volume (OBV): The OBV has been fluctuating, suggesting indecision among investors.
- Chaikin Money Flow (CMF): The CMF has been negative, indicating selling pressure in the market.
Key Observations and Opinions:
- Trend: The trend indicators suggest a bullish bias in the short term.
- Momentum: Momentum indicators point towards a potential reversal or pullback due to overbought conditions.
- Volatility: High volatility near the upper Bollinger Band signals a possible correction.
- Volume: Mixed signals from volume indicators indicate uncertainty in market sentiment.
Conclusion:
Based on the analysis of technical indicators, the stock price of GOEX is likely to experience a short-term pullback or correction in the coming days. The overbought conditions indicated by momentum indicators, coupled with high volatility near the upper Bollinger Band, suggest a potential reversal in price. Traders should exercise caution and consider taking profits or implementing risk management strategies in anticipation of a downward price movement.