Technical Analysis of GOLY 2024-05-10
Overview:
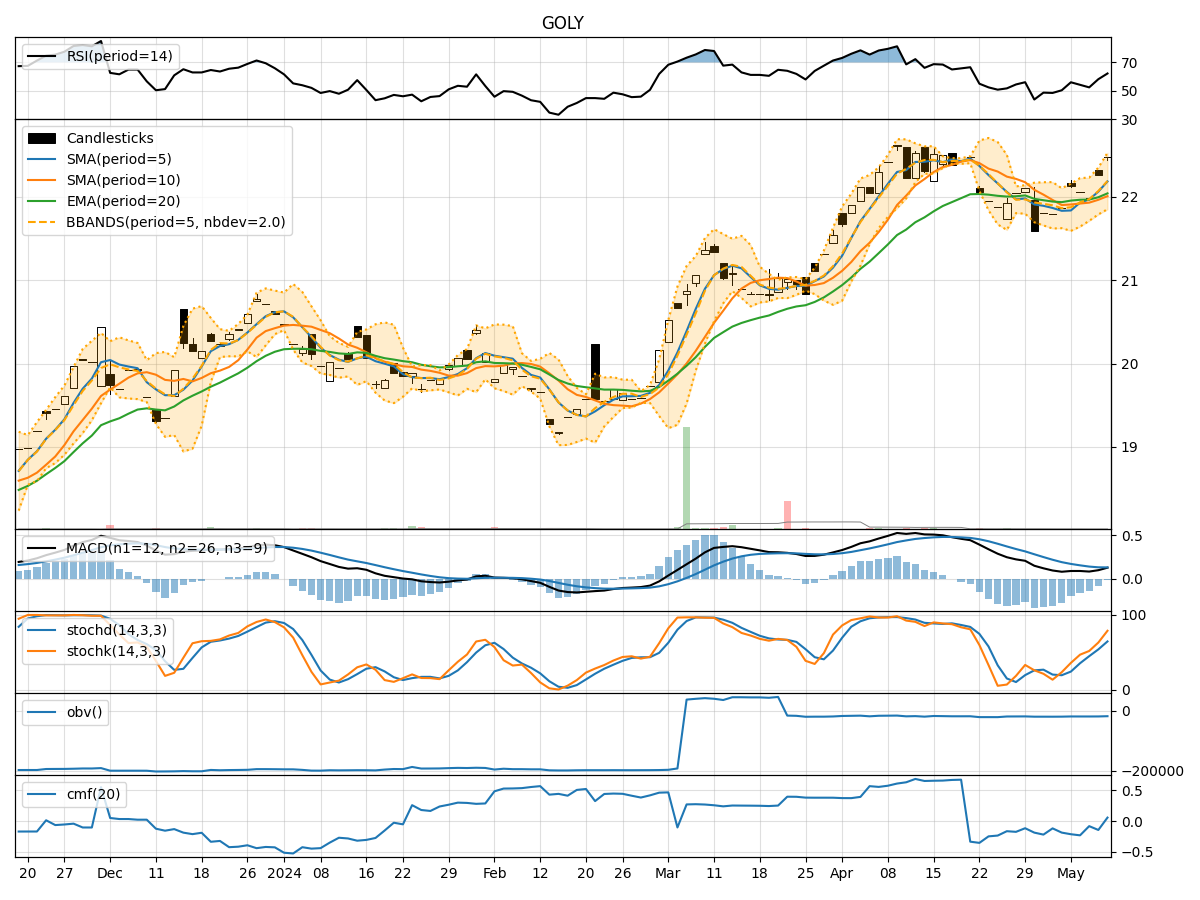
In the last 5 trading days, GOLY stock has shown mixed signals across various technical indicators. The stock price has been fluctuating within a certain range, indicating indecision in the market. We will analyze the trend, momentum, volatility, and volume indicators to provide insights into the possible future movement of GOLY stock.
Trend Analysis:
- Moving Averages (MA): The 5-day MA has been above the closing price, indicating a short-term uptrend. However, the SMA(10) and EMA(20) are relatively flat, suggesting a lack of strong trend direction.
- MACD: The MACD line has been consistently positive, but the MACD Histogram has been decreasing, indicating a potential weakening of the uptrend.
Momentum Analysis:
- RSI: The RSI has been fluctuating around the 50 level, indicating a lack of strong momentum in either direction.
- Stochastic Oscillator: Both %K and %D have been in the overbought zone, suggesting a potential reversal or consolidation phase.
- Williams %R: The Williams %R is close to the oversold territory, indicating a possible buying opportunity.
Volatility Analysis:
- Bollinger Bands: The stock price has been trading within the Bollinger Bands, suggesting a period of consolidation. The bands are relatively narrow, indicating low volatility.
- Bollinger %B: The %B indicator is hovering around 0.5, indicating the stock is trading at the middle of the bands.
Volume Analysis:
- On-Balance Volume (OBV): The OBV has been relatively flat, indicating a balance between buying and selling pressure.
- Chaikin Money Flow (CMF): The CMF has been negative, suggesting that money is flowing out of the stock.
Key Observations:
- The stock is currently in a consolidation phase with mixed signals from different indicators.
- The lack of strong trend direction and the presence of conflicting signals indicate uncertainty in the market.
- The stock is trading within a narrow range with low volatility, suggesting a potential breakout in either direction.
Conclusion:
Based on the analysis of the technical indicators, the next few days for GOLY stock are likely to see sideways movement with a potential for a breakout. Traders should closely monitor key levels such as the upper and lower Bollinger Bands for potential entry or exit points. The stock is currently in a consolidation phase, and a clear trend direction is yet to be established. Exercise caution and wait for a clearer signal before making significant trading decisions.