Technical Analysis of GOOX 2024-05-10
Overview:
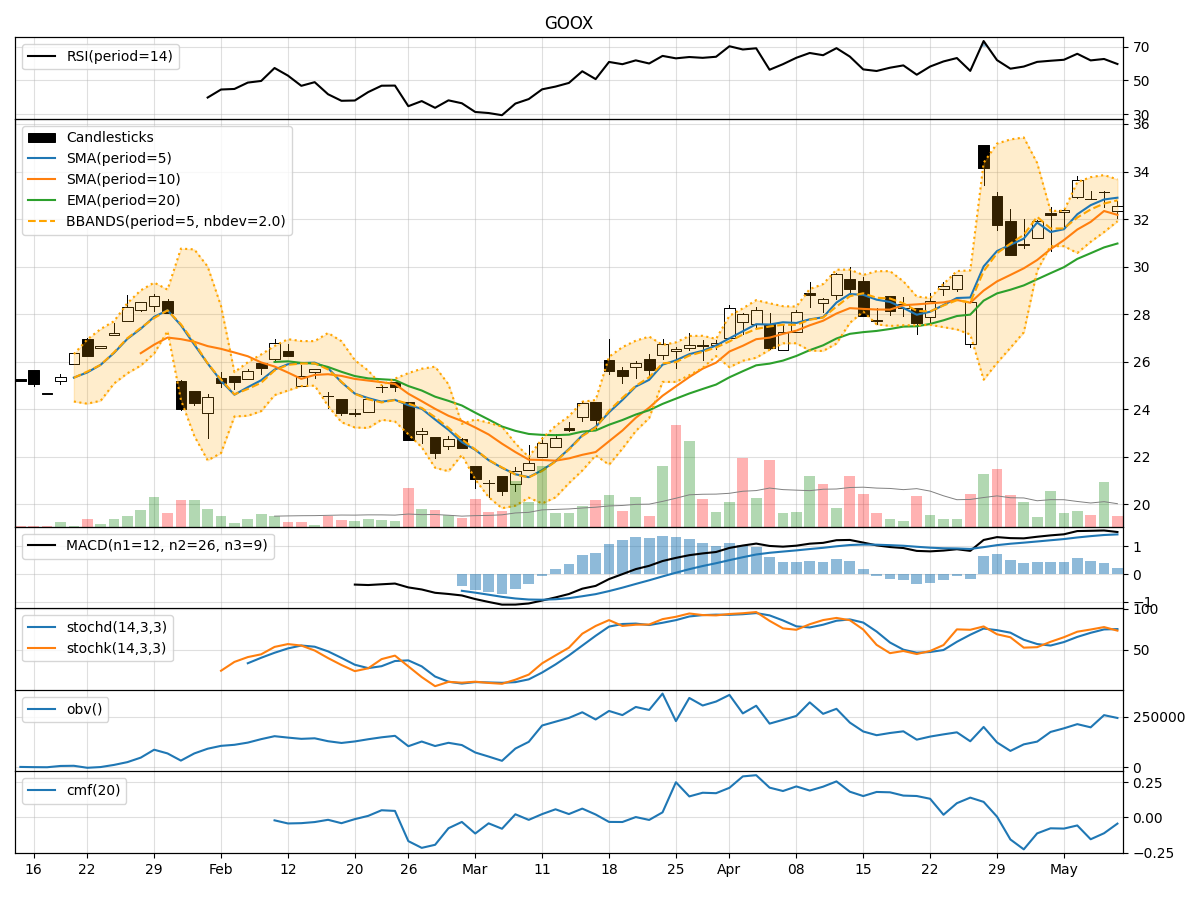
In analyzing the technical indicators for GOOX over the last 5 days, we will delve into the trend, momentum, volatility, and volume indicators to provide a comprehensive outlook on the possible stock price movement in the coming days. By examining these key indicators, we aim to offer valuable insights and predictions for potential investors and traders.
Trend Analysis:
- Moving Averages (MA): The moving averages show a consistent uptrend over the last 5 days, with the closing price consistently above the short-term moving averages.
- MACD: The MACD line has been consistently above the signal line, indicating a bullish trend.
- EMA: The exponential moving average has been steadily increasing, supporting the bullish sentiment.
Key Observation: The trend indicators suggest a strong bullish trend in the short term.
Momentum Analysis:
- RSI: The Relative Strength Index has been hovering around the overbought territory, indicating strong buying momentum.
- Stochastic Oscillator: Both %K and %D have been in the overbought zone, signaling a strong bullish momentum.
- Williams %R: The indicator has been consistently in the oversold region, suggesting a potential reversal.
Key Observation: Momentum indicators point towards a continuation of the bullish momentum.
Volatility Analysis:
- Bollinger Bands: The bands have been relatively narrow, indicating low volatility in the stock price.
- Bollinger %B: The %B indicator has been hovering around the middle range, suggesting a balanced market sentiment.
Key Observation: Volatility indicators suggest a period of consolidation or sideways movement.
Volume Analysis:
- On-Balance Volume (OBV): The OBV has shown mixed signals, with fluctuations in volume but no clear trend.
- Chaikin Money Flow (CMF): The CMF has been negative, indicating selling pressure in the market.
Key Observation: Volume indicators do not provide a clear direction, signaling uncertainty in market participation.
Conclusion:
Based on the analysis of the technical indicators, the next few days for GOOX are likely to see continued upward movement in the stock price, supported by the strong bullish trend and momentum indicators. However, the low volatility and mixed volume signals suggest a possible period of consolidation before further upside potential. Traders should consider entering long positions cautiously, keeping an eye on key support and resistance levels for potential profit-taking opportunities.
Key Takeaways:
- Bullish Trend: Expect upward movement in the stock price.
- Consolidation: Anticipate a period of sideways movement.
- Caution: Exercise prudent risk management strategies in volatile market conditions.
By combining insights from trend, momentum, volatility, and volume indicators, investors can make informed decisions to navigate the dynamic stock market environment effectively.