Technical Analysis of GOVI 2024-05-10
Overview:
In analyzing the technical indicators for GOVI stock over the last 5 days, we will delve into the trend, momentum, volatility, and volume indicators to provide a comprehensive outlook on the possible stock price movement in the coming days. By examining these key indicators, we aim to offer valuable insights and predictions for potential investors.
Trend Indicators:
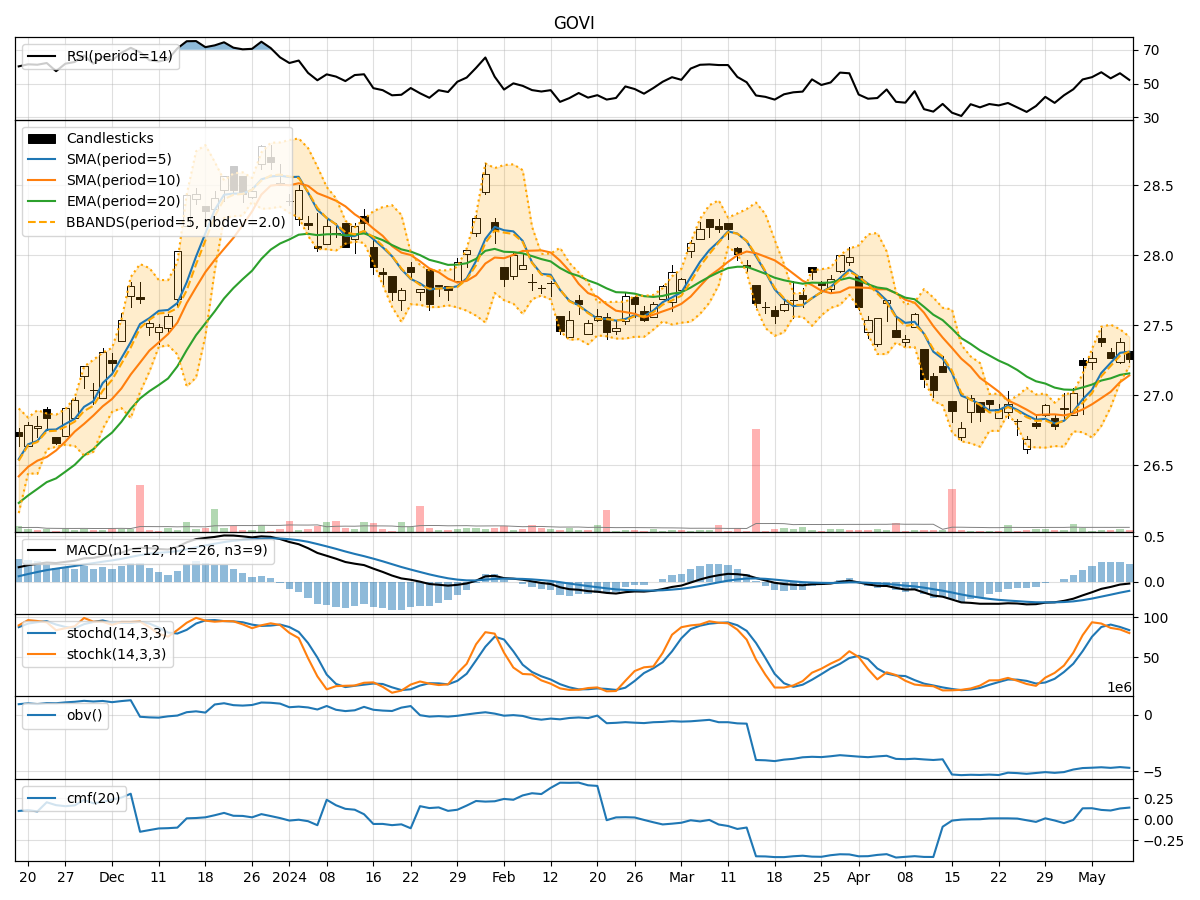
- Moving Averages (MA): The 5-day Moving Average (MA) has been relatively stable around the current stock price, indicating a neutral trend.
- MACD: The Moving Average Convergence Divergence (MACD) has shown a slight negative trend, suggesting a potential bearish momentum.
- EMA: The Exponential Moving Average (EMA) has been slightly above the current stock price, indicating a possible bullish sentiment.
Momentum Indicators:
- RSI: The Relative Strength Index (RSI) has been fluctuating around the neutral level, suggesting a lack of strong momentum in either direction.
- Stochastic Oscillator: The Stochastic Oscillator indicates that the stock is not in overbought or oversold territory, reflecting a balanced momentum.
- Williams %R: The Williams %R is also hovering around the midpoint, indicating a neutral momentum.
Volatility Indicators:
- Bollinger Bands: The Bollinger Bands have shown a narrowing range, indicating decreasing volatility in the stock price.
- Volatility Bands: The Volatility Bands have been relatively stable, suggesting a lack of significant price fluctuations.
Volume Indicators:
- On-Balance Volume (OBV): The OBV has shown a slight decrease, indicating some selling pressure in the stock.
- Chaikin Money Flow (CMF): The CMF has been positive, suggesting that money is flowing into the stock despite the recent decrease in OBV.
Key Observations:
- The trend indicators show a mixed outlook with a slight bearish bias in the MACD.
- Momentum indicators suggest a lack of strong directional momentum in either direction.
- Volatility indicators point towards decreasing volatility in the stock price.
- Volume indicators indicate a slight increase in selling pressure but with positive money flow into the stock.
Conclusion:
Based on the analysis of the technical indicators, the stock price of GOVI is likely to experience a period of consolidation or sideways movement in the next few days. The lack of strong trends in both momentum and trend indicators, coupled with decreasing volatility, suggests a period of stability in the stock price. Investors may expect the stock to trade within a narrow range without significant price movements. It is advisable to closely monitor the key support and resistance levels for potential breakout opportunities in the future.