Technical Analysis of GOVT 2024-05-10
Overview:
In analyzing the technical indicators for GOVT over the last 5 days, we will delve into the trend, momentum, volatility, and volume indicators to provide a comprehensive outlook on the possible stock price movement in the coming days. By examining these key aspects, we aim to offer valuable insights and predictions for potential investors.
Trend Analysis:
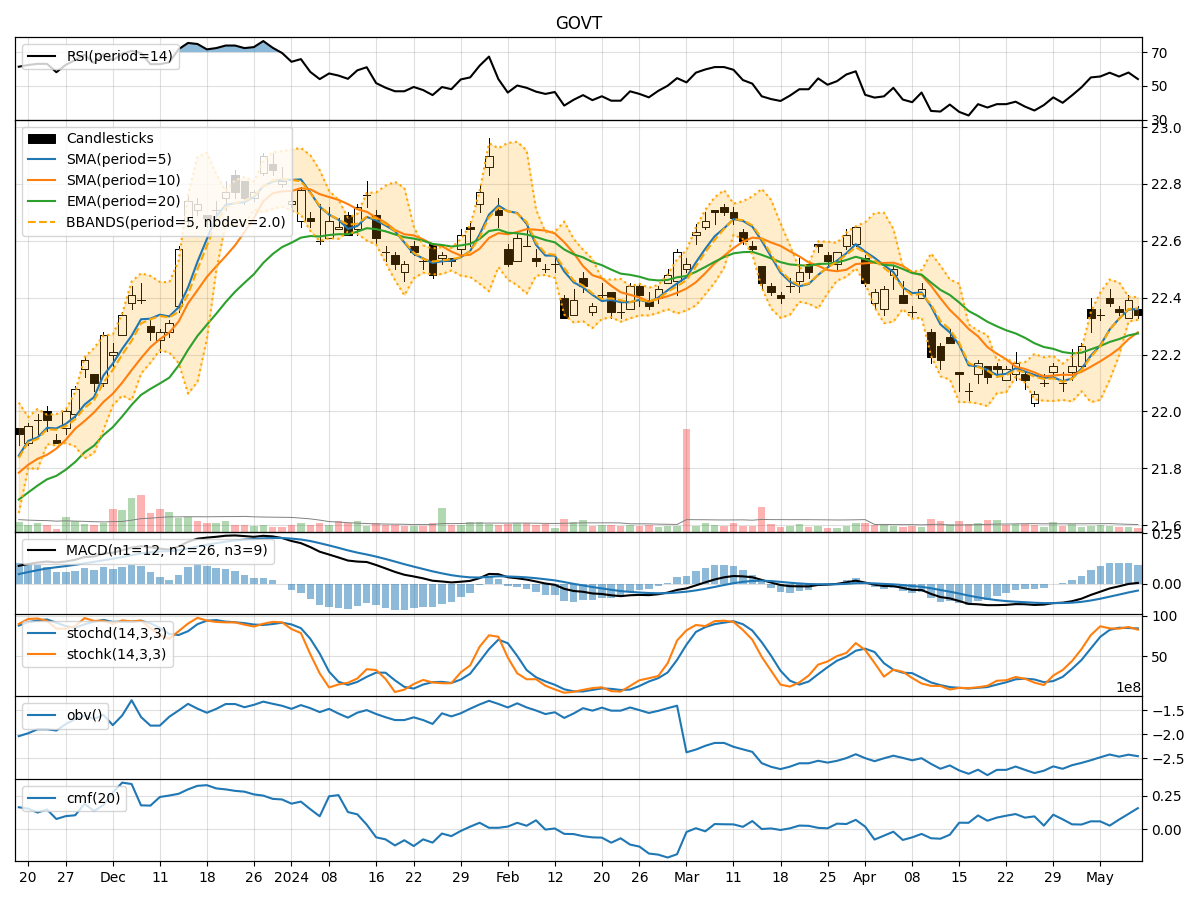
- Moving Averages (MA): The 5-day Moving Average (MA) has been relatively stable around the current stock price, indicating a neutral trend.
- MACD: The Moving Average Convergence Divergence (MACD) has shown a slight positive trend, with the MACD line crossing above the signal line, suggesting a potential bullish momentum.
- EMA: The Exponential Moving Average (EMA) has been gradually increasing, indicating a positive trend in the stock price.
Momentum Analysis:
- RSI: The Relative Strength Index (RSI) has been fluctuating around the neutral level of 50, suggesting a lack of strong momentum in either direction.
- Stochastic Oscillator: Both %K and %D values of the Stochastic Oscillator are in the overbought region, indicating a potential reversal or consolidation phase.
- Williams %R: The Williams %R is in the oversold region, signaling a potential buying opportunity.
Volatility Analysis:
- Bollinger Bands: The Bollinger Bands are narrowing, indicating decreasing volatility and a possible period of consolidation.
- Bollinger %B: The %B indicator is hovering around the middle range, suggesting a balanced market sentiment.
Volume Analysis:
- On-Balance Volume (OBV): The OBV has been fluctuating, indicating mixed buying and selling pressure in the stock.
- Chaikin Money Flow (CMF): The CMF has been positive, suggesting that money flow into the stock has been relatively strong.
Conclusion:
Based on the analysis of the technical indicators, the stock of GOVT is likely to experience sideways movement in the coming days. The trend indicators show a potential bullish bias, supported by the positive MACD and EMA trends. However, the momentum indicators suggest a lack of strong buying pressure, with the RSI hovering around the neutral level. The volatility indicators point towards a period of consolidation, while the volume indicators indicate mixed market sentiment.
Therefore, considering all the factors, it is recommended to exercise caution and closely monitor the stock price movement for any potential breakout or reversal signals before making any trading decisions.