Technical Analysis of GPOW 2024-05-10
Overview:
In analyzing the technical indicators for GPOW over the last 5 days, we will delve into the trend, momentum, volatility, and volume indicators to provide a comprehensive outlook on the possible stock price movement in the coming days. By examining these key indicators, we aim to offer valuable insights and predictions for informed decision-making.
Trend Indicators:
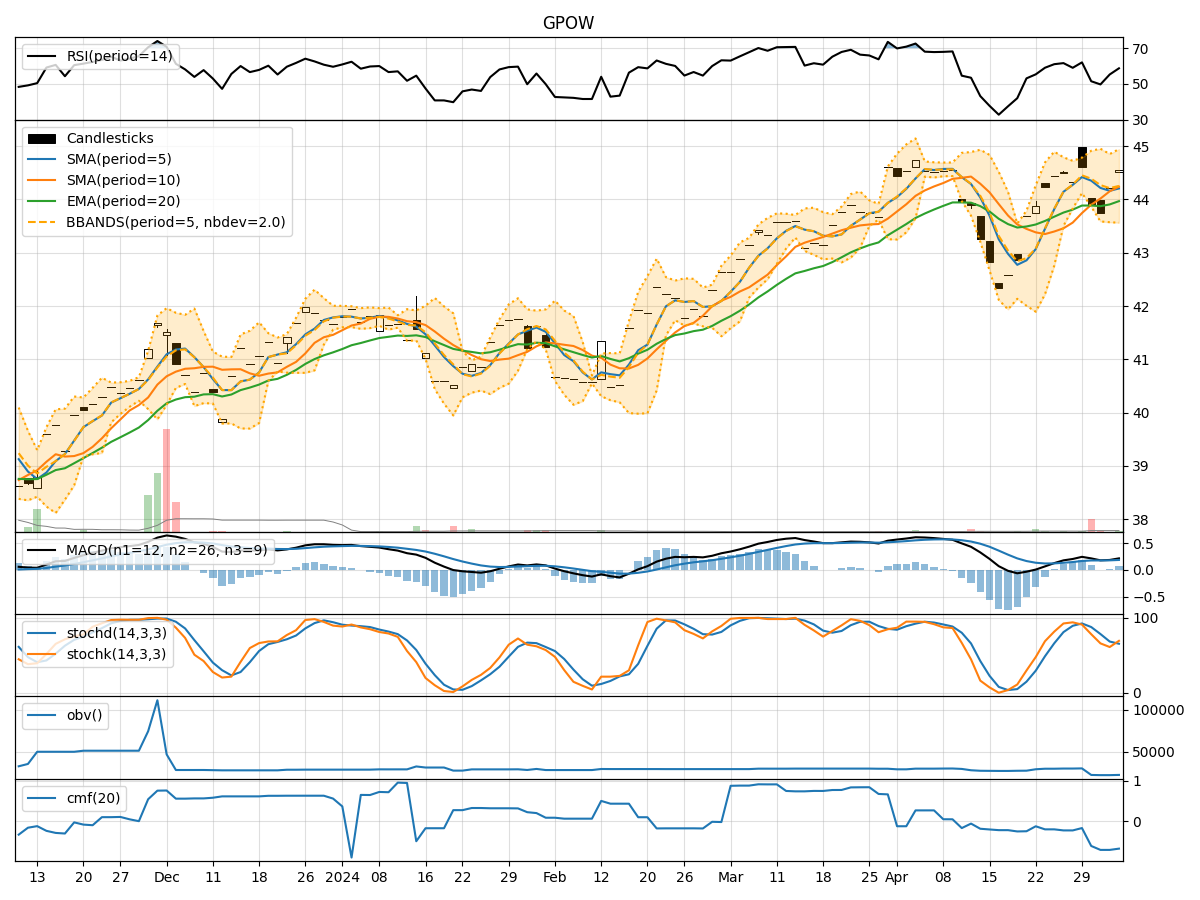
- Moving Averages (MA): The 5-day moving average has been consistently rising, indicating a bullish trend in the short term.
- MACD: The MACD line has been increasing, and the MACD histogram is also showing positive values, suggesting upward momentum.
Momentum Indicators:
- RSI: The RSI has been trending upwards, indicating increasing buying pressure.
- Stochastic Oscillator: Both %K and %D lines are in the overbought zone, signaling a strong bullish momentum.
Volatility Indicators:
- Bollinger Bands (BB): The stock price has been trading near the upper Bollinger Band, suggesting high volatility and potential overbought conditions.
Volume Indicators:
- On-Balance Volume (OBV): The OBV has been declining, indicating a decrease in buying volume.
- Chaikin Money Flow (CMF): The CMF has been negative, reflecting selling pressure in the stock.
Key Observations:
- The trend indicators and momentum indicators both point towards a bullish outlook in the short term.
- However, the high volatility indicated by the Bollinger Bands and the declining OBV and negative CMF suggest a potential reversal or consolidation phase.
Conclusion:
Based on the analysis of the technical indicators, the next few days for GPOW could see a short-term upward movement followed by a possible correction or consolidation. Traders should be cautious of the high volatility and monitor for signs of a trend reversal. It is advisable to consider taking profits on long positions and wait for a clearer signal before entering new positions.