Technical Analysis of GQI 2024-05-10
Overview:
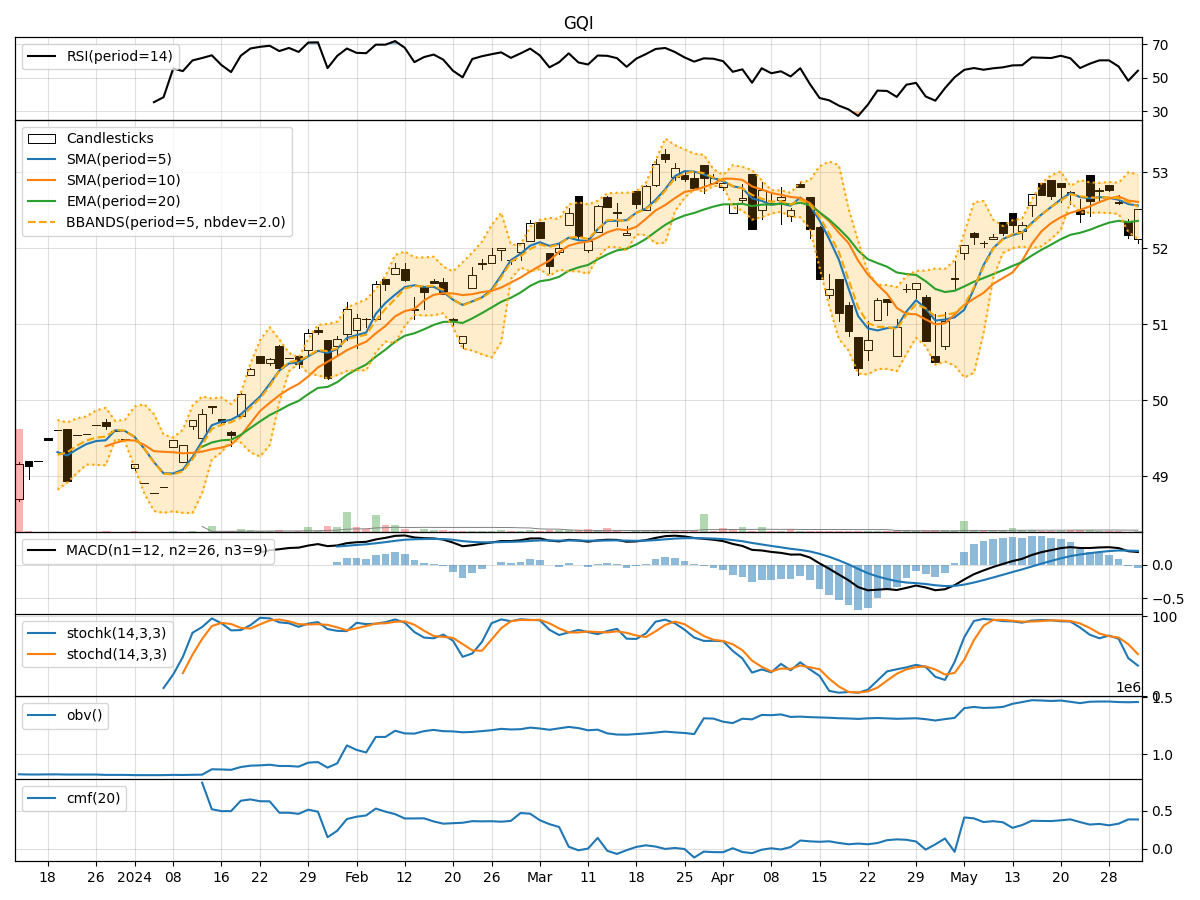
In analyzing the technical indicators for GQI over the last 5 days, we will delve into the trend, momentum, volatility, and volume indicators to provide a comprehensive outlook on the possible stock price movement in the coming days. By examining these key aspects, we aim to offer valuable insights and recommendations for potential investors.
Trend Analysis:
- Moving Averages (MA): The 5-day Moving Average (MA) has been consistently above the Simple Moving Average (SMA) and Exponential Moving Average (EMA) over the past 5 days, indicating a bullish trend.
- MACD: The Moving Average Convergence Divergence (MACD) has shown positive values, with the MACD line consistently above the Signal line, suggesting bullish momentum in the stock price.
Momentum Analysis:
- RSI: The Relative Strength Index (RSI) has been trending upwards, indicating positive momentum in the stock.
- Stochastic Oscillator: Both %K and %D lines of the Stochastic Oscillator are in the overbought region, suggesting a potential reversal in the stock price.
Volatility Analysis:
- Bollinger Bands (BB): The Bollinger Bands have been narrowing, indicating decreasing volatility in the stock price.
Volume Analysis:
- On-Balance Volume (OBV): The OBV has shown a slight increase over the past 5 days, suggesting accumulation of the stock.
- Chaikin Money Flow (CMF): The CMF has been positive, indicating buying pressure in the stock.
Key Observations:
- The trend indicators suggest a bullish bias in the stock price movement.
- Momentum indicators show positive momentum but also hint at a potential reversal due to overbought conditions.
- Volatility has been decreasing, indicating stability in the stock price.
- Volume indicators point towards accumulation and buying pressure in the stock.
Conclusion:
Based on the analysis of the technical indicators, the next few days' possible stock price movement for GQI is likely to be upward with a bullish bias. However, caution is advised as the Stochastic Oscillator signals a potential reversal due to overbought conditions. Investors should closely monitor the price action and consider taking profits or implementing risk management strategies in case of a sudden downturn. Overall, the outlook for GQI appears positive but with a need for vigilance in the face of potential market corrections.