Technical Analysis of GRNB 2024-05-10
Overview:
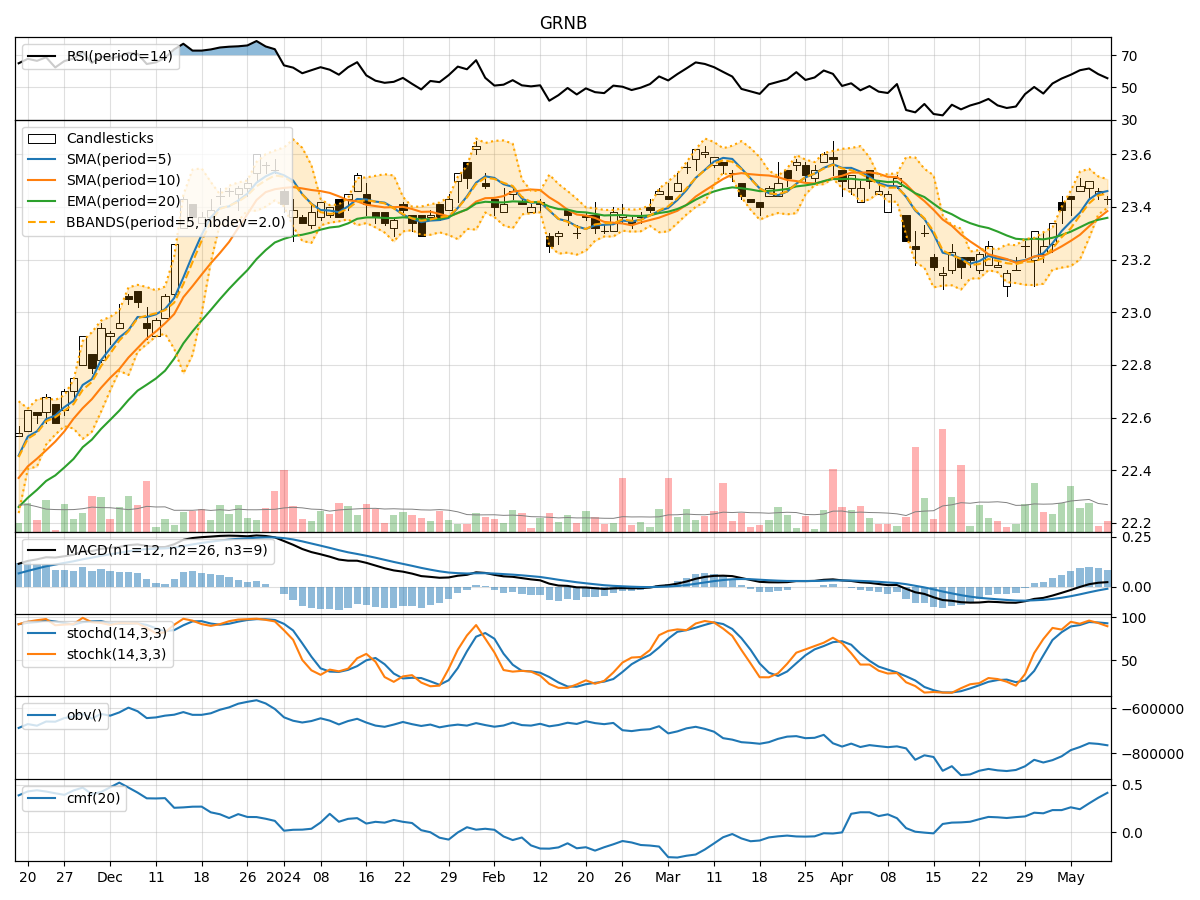
In analyzing the technical indicators for GRNB over the last 5 days, we will delve into the trend, momentum, volatility, and volume indicators to provide a comprehensive outlook on the possible stock price movement in the coming days.
Trend Analysis:
- Moving Averages (MA): The 5-day Moving Average (MA) has been consistently above the Simple Moving Average (SMA) and Exponential Moving Average (EMA), indicating a bullish trend.
- MACD: The MACD line has been consistently above the signal line, with both lines showing an upward trend, suggesting bullish momentum.
Momentum Analysis:
- RSI: The Relative Strength Index (RSI) has been fluctuating around the 50 level, indicating a neutral momentum.
- Stochastic Oscillator: Both %K and %D have been decreasing, signaling a potential bearish momentum.
Volatility Analysis:
- Bollinger Bands (BB): The stock price has been trading within the Bollinger Bands, with the bands narrowing, suggesting decreasing volatility.
Volume Analysis:
- On-Balance Volume (OBV): The OBV has been fluctuating, indicating indecision among investors.
- Chaikin Money Flow (CMF): The CMF has been positive, suggesting buying pressure in the stock.
Key Observations:
- The trend indicators point towards a bullish sentiment in the short term.
- Momentum indicators show a mixed signal, with RSI neutral and Stochastic Oscillator indicating a potential bearish momentum.
- Volatility has been decreasing, indicating a possible consolidation phase.
- Volume indicators suggest indecision among investors but with a slight buying pressure.
Conclusion:
Based on the analysis of the technical indicators, the next few days' possible stock price movement for GRNB is likely to be sideways with a slight bearish bias. The bullish trend indicated by moving averages and MACD may face resistance due to the neutral RSI and potential bearish momentum suggested by the Stochastic Oscillator. The decreasing volatility and mixed volume signals further support the view of a sideways movement with a slight downward bias.
Recommendation:
- Short-term Traders: Consider taking profits or implementing tight stop-loss orders to manage risk in a sideways market.
- Long-term Investors: Monitor the price action closely for potential entry points during consolidation phases.
Always remember to conduct further research and consider fundamental factors before making any investment decisions.