Technical Analysis of GRPM 2024-05-10
Overview:
In analyzing the technical indicators for GRPM over the last 5 days, we will delve into the trend, momentum, volatility, and volume indicators to provide a comprehensive outlook on the possible stock price movement in the coming days. By examining these key aspects, we aim to offer valuable insights and predictions for informed decision-making.
Trend Indicators:
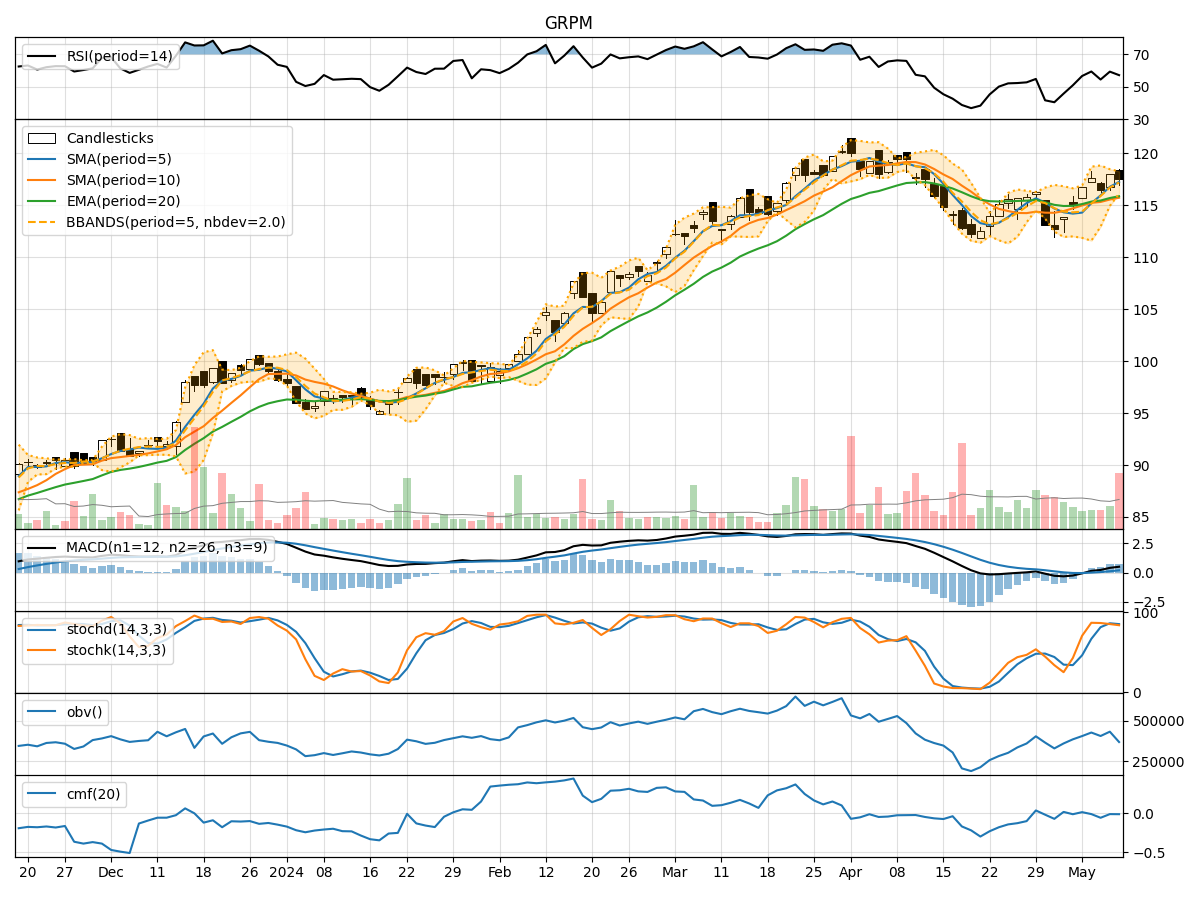
- Moving Averages (MA): The 5-day MA has been trending above the 10-day SMA, indicating a short-term bullish trend. The EMA(20) has been steadily increasing, suggesting a positive momentum in the stock price.
- MACD: The MACD line has been consistently above the signal line, with both lines showing an upward trend. This signals a bullish momentum in the stock.
- Conclusion: The trend indicators suggest an upward momentum in the stock price.
Momentum Indicators:
- RSI: The RSI has been fluctuating around the 50 level, indicating a neutral momentum in the stock.
- Stochastic Oscillator: Both %K and %D have been hovering in the overbought zone, suggesting a potential reversal or consolidation.
- Williams %R: The Williams %R has been oscillating near the oversold territory, indicating a possible buying opportunity.
- Conclusion: The momentum indicators are mixed, with a slight bias towards a neutral stance.
Volatility Indicators:
- Bollinger Bands: The stock price has been trading within the Bollinger Bands, with the bands narrowing, indicating a decrease in volatility.
- Conclusion: The volatility indicators suggest a low volatility environment in the stock.
Volume Indicators:
- On-Balance Volume (OBV): The OBV has been fluctuating, indicating indecision among market participants.
- Chaikin Money Flow (CMF): The CMF has been negative, suggesting a net outflow of money from the stock.
- Conclusion: The volume indicators point towards uncertainty in the stock's trading activity.
Overall Conclusion:
Based on the analysis of the technical indicators, the stock of GRPM is currently experiencing an upward trend, supported by the MACD and moving averages. However, the momentum indicators are mixed, indicating a neutral stance. The volatility is low, suggesting a lack of significant price movements. The volume indicators reflect uncertainty in market participation.
Forecast:
Considering the overall analysis, the next few days for GRPM could see sideways consolidation with a potential for a slight upward bias in the stock price. Traders and investors should closely monitor key support and resistance levels for potential breakout opportunities. It is advisable to wait for clearer signals from the momentum indicators before taking significant trading positions.
Disclaimer:
Remember that technical analysis is not a guaranteed predictor of future price movements, and other fundamental factors can influence stock prices. It is essential to conduct thorough research and consider multiple indicators before making any investment decisions. Consulting with a financial advisor can provide tailored insights based on your specific investment goals and risk tolerance level.