Technical Analysis of GSC 2024-05-10
Overview:
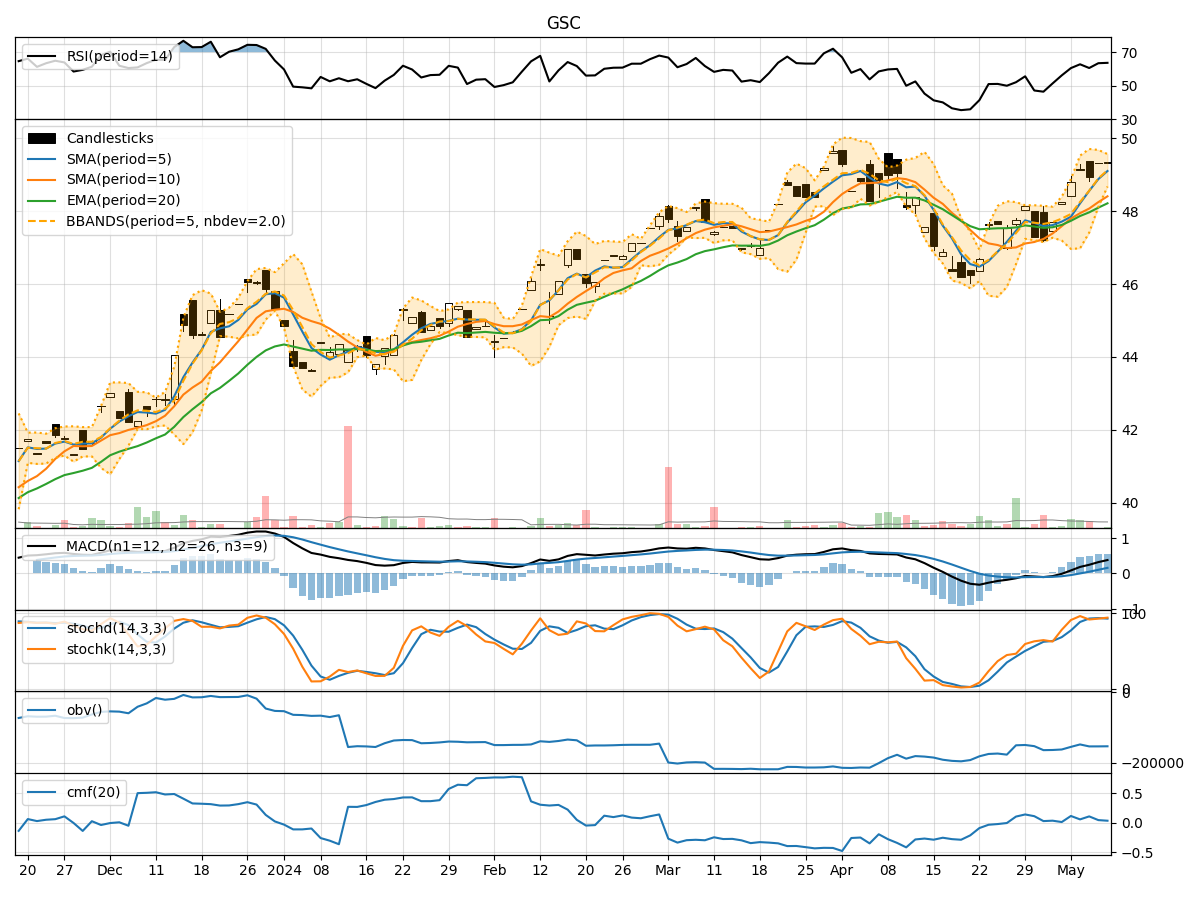
In the last 5 trading days, GSC stock has shown a consistent uptrend in its price, with increasing volumes. The trend indicators suggest a positive momentum, supported by the moving averages and MACD. Momentum indicators like RSI and Stochastic oscillators indicate overbought conditions but still show strength. Volatility indicators show narrowing Bollinger Bands, indicating potential price consolidation. Volume indicators suggest mixed signals with some distribution in OBV but positive CMF values.
Trend Analysis:
- Moving Averages (MA): The 5-day MA has been consistently above the longer-term SMAs, indicating a short-term bullish trend.
- MACD: The MACD line has been above the signal line, showing positive momentum.
- EMA: The EMA has been steadily increasing, supporting the bullish trend.
Momentum Analysis:
- RSI: The RSI is in the overbought territory but has been trending upwards, indicating strong buying pressure.
- Stochastic Oscillators: Both %K and %D have been in the overbought zone, suggesting a potential reversal, but the trend is still strong.
- Williams %R: The Williams %R is also in the oversold region, indicating a potential pullback.
Volatility Analysis:
- Bollinger Bands (BB): The narrowing of the Bollinger Bands suggests decreasing volatility and a possible period of consolidation.
- BB %B: The %B indicator is below 1, indicating the price is below the upper Bollinger Band, potentially signaling a short-term pullback.
Volume Analysis:
- On-Balance Volume (OBV): The OBV has shown some distribution in the last few days, indicating selling pressure.
- Chaikin Money Flow (CMF): The CMF has been positive, suggesting that money is flowing into the stock despite some distribution.
Conclusion:
Based on the technical indicators and analysis: - Trend: The stock is in a strong upward trend. - Momentum: Momentum indicators suggest overbought conditions but still show strength. - Volatility: Volatility is decreasing, indicating a potential period of consolidation. - Volume: Mixed signals with some distribution but overall positive money flow.
Forecast:
Given the overall bullish trend and positive momentum, the stock is likely to continue its upward movement in the short term. However, the overbought conditions and narrowing Bollinger Bands suggest a possible consolidation or minor pullback before resuming the uptrend. Traders should watch for key support levels and consider taking profits on any significant rallies. Expect a short-term consolidation before a potential continuation of the uptrend.