Technical Analysis of GSEE 2024-05-10
Overview:
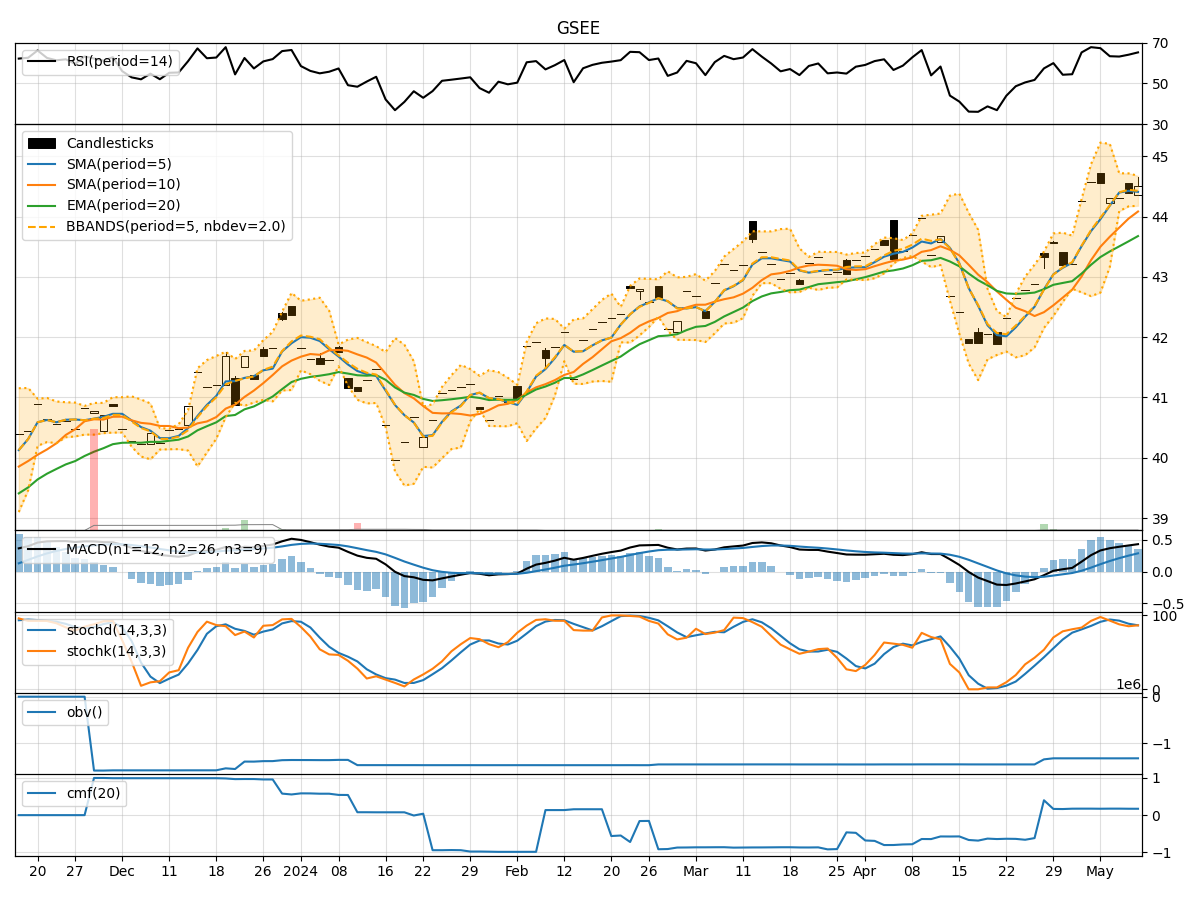
In the last 5 trading days, GSEE stock has shown a relatively stable performance with minor fluctuations in price and volume. The trend indicators suggest a gradual increase in the moving averages and MACD values. Momentum indicators like RSI and Stochastic oscillators indicate a slightly overbought condition but still within reasonable levels. Volatility indicators show a narrowing Bollinger Bands range, indicating decreasing price volatility. Volume indicators reflect a consistent but not significant change in the On-Balance Volume and Chaikin Money Flow values.
Trend Indicators Analysis:
- Moving averages (MA) have been on an upward trend, indicating a bullish sentiment in the short term.
- MACD values have been increasing, suggesting strengthening bullish momentum.
- Overall, the trend indicators point towards a bullish outlook for the stock.
Momentum Indicators Analysis:
- RSI values have been in the overbought territory but not at extreme levels, indicating potential for further upside.
- Stochastic oscillators show a slight decline but still in the bullish zone.
- The momentum indicators suggest a slightly bullish sentiment for the stock.
Volatility Indicators Analysis:
- Bollinger Bands are narrowing, indicating decreasing price volatility and a potential breakout in the near future.
- The decreasing Bollinger Bands percentage (BBP) suggests a period of consolidation or a potential price breakout.
- Volatility indicators hint at a consolidation phase for the stock.
Volume Indicators Analysis:
- On-Balance Volume (OBV) has shown a slight increase, reflecting a consistent accumulation of the stock.
- Chaikin Money Flow (CMF) remains positive but relatively stable, indicating a steady inflow of money into the stock.
- Volume indicators suggest a neutral to slightly bullish sentiment.
Conclusion:
Based on the comprehensive analysis of trend, momentum, volatility, and volume indicators, the next few days for GSEE stock are likely to see a bullish movement. The trend is positive, momentum is slightly bullish, volatility indicates a consolidation phase, and volume remains steady with a slight bullish bias. Investors may consider entering long positions or holding onto existing positions with a target of potential upside in the stock price. However, it is essential to monitor the breakout potential indicated by the narrowing Bollinger Bands and adjust strategies accordingly.