Technical Analysis of GSEP 2024-05-10
Overview:
In analyzing the technical indicators for GSEP over the last 5 days, we will delve into the trend, momentum, volatility, and volume indicators to provide a comprehensive outlook on the possible stock price movement in the coming days. By examining these key indicators, we aim to offer valuable insights and predictions for potential investors.
Trend Analysis:
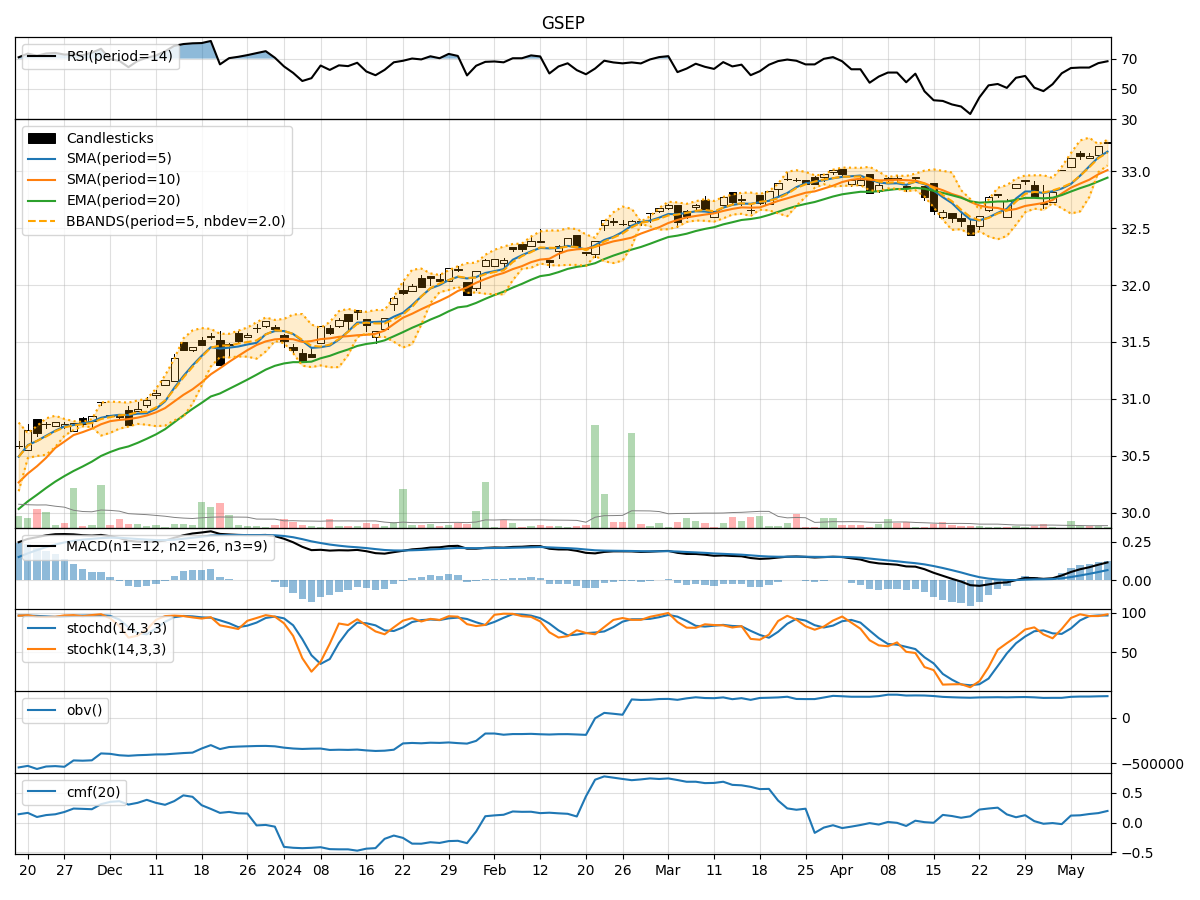
- Moving Averages (MA): The 5-day Moving Average (MA) has been consistently above the Simple Moving Average (SMA) and Exponential Moving Average (EMA), indicating a bullish trend.
- MACD: The Moving Average Convergence Divergence (MACD) has shown positive values, with the MACD line consistently above the Signal line, suggesting a bullish momentum.
Momentum Analysis:
- RSI: The Relative Strength Index (RSI) has been in the overbought territory, indicating a strong bullish momentum.
- Stochastic Oscillator: Both %K and %D have been in the overbought zone, suggesting a potential reversal or consolidation.
Volatility Analysis:
- Bollinger Bands (BB): The stock price has mostly remained within the Bollinger Bands, with the bands narrowing, indicating decreasing volatility.
Volume Analysis:
- On-Balance Volume (OBV): The OBV has shown a slight increase, indicating buying pressure.
- Chaikin Money Flow (CMF): The CMF has been positive, reflecting a bullish money flow into the stock.
Key Observations:
- The trend indicators suggest a strong bullish sentiment, supported by the positive MACD values and moving averages.
- Momentum indicators, such as RSI and Stochastic Oscillator, indicate an overbought condition, which may lead to a potential reversal or consolidation.
- Volatility has been decreasing, as seen in the narrowing Bollinger Bands, signaling a period of consolidation or a potential breakout.
- Volume indicators show a slight increase in buying pressure, as reflected in the OBV and CMF values.
Conclusion:
Based on the analysis of the technical indicators, the stock of GSEP is currently in an overbought state with a bullish trend. However, the momentum indicators suggest a potential reversal or consolidation in the near future. The decreasing volatility and increasing buying pressure indicate a period of sideways movement or a potential breakout.
Recommendation:
Considering the overbought conditions and potential reversal signals from the momentum indicators, investors should exercise caution. It is advisable to wait for confirmation of a new trend direction before making any significant trading decisions. Monitoring the price action closely and waiting for a clear breakout or reversal pattern would be prudent in this scenario.