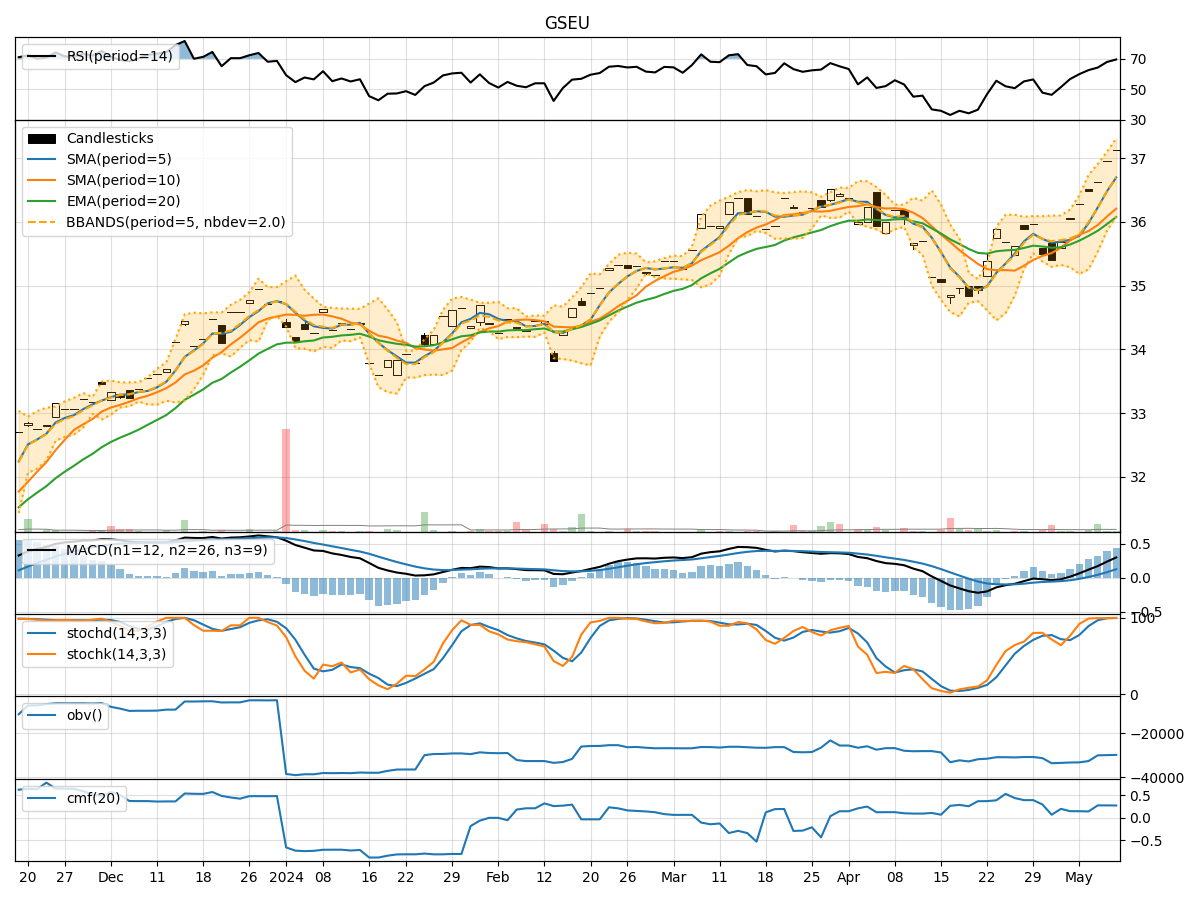
Technical Analysis of GSEU 2024-05-10
Overview:
In the last 5 trading days, GSEU stock has shown a consistent uptrend in price, supported by increasing volume and positive momentum indicators. The stock has also exhibited low volatility, indicating stability in its price movements.
Trend Analysis:
- Moving Averages (MA): The 5-day Moving Average (MA) has been consistently above the Simple Moving Average (SMA) and Exponential Moving Average (EMA), indicating a bullish trend.
- MACD: The MACD line has been consistently above the signal line, with both lines showing an upward trend, suggesting further price appreciation.
- Momentum: The Relative Strength Index (RSI) has been increasing, indicating strengthening buying momentum.
Momentum Analysis:
- RSI: The RSI has been trending upwards, reaching levels above 70, indicating overbought conditions but also strong bullish momentum.
- Stochastic Oscillator: Both %K and %D lines of the Stochastic Oscillator are in the overbought zone, suggesting a potential reversal or consolidation in the near term.
Volatility Analysis:
- Bollinger Bands (BB): The Bollinger Bands have been relatively narrow, indicating low volatility and a period of consolidation.
- Bollinger Band Percentage (BBP): The BBP values have been below 1, indicating that the price is trading within the bands and not exhibiting extreme volatility.
Volume Analysis:
- On-Balance Volume (OBV): The OBV has been consistently positive, indicating strong buying pressure and accumulation of the stock.
- Chaikin Money Flow (CMF): The CMF has been positive, reflecting buying pressure over the past 20 days.
Key Observations:
- The stock is in a strong uptrend, supported by positive momentum and volume indicators.
- Low volatility suggests a period of consolidation or a potential breakout.
- Overbought conditions on the RSI and Stochastic Oscillator may lead to a short-term pullback or consolidation.
Conclusion:
Based on the technical indicators and analysis: - Short-Term: The stock may experience a brief consolidation or pullback due to overbought conditions on the RSI and Stochastic Oscillator. - Medium- to Long-Term: The overall trend remains bullish, supported by strong buying pressure and positive momentum indicators. Further upside movement is likely once the stock consolidates or retraces slightly.
Recommendation:
- Upcoming Days: Expect a short-term consolidation or minor pullback.
- Longer-Term: The bullish trend is intact, and any dips could present buying opportunities for investors looking to capitalize on the stock's upward momentum.
Key Words:
- Consolidation: Short-term consolidation expected.
- Bullish: Overall trend remains bullish.
- Pullback: Potential for a minor pullback in the short term.