Technical Analysis of GSIB 2024-05-10
Overview:
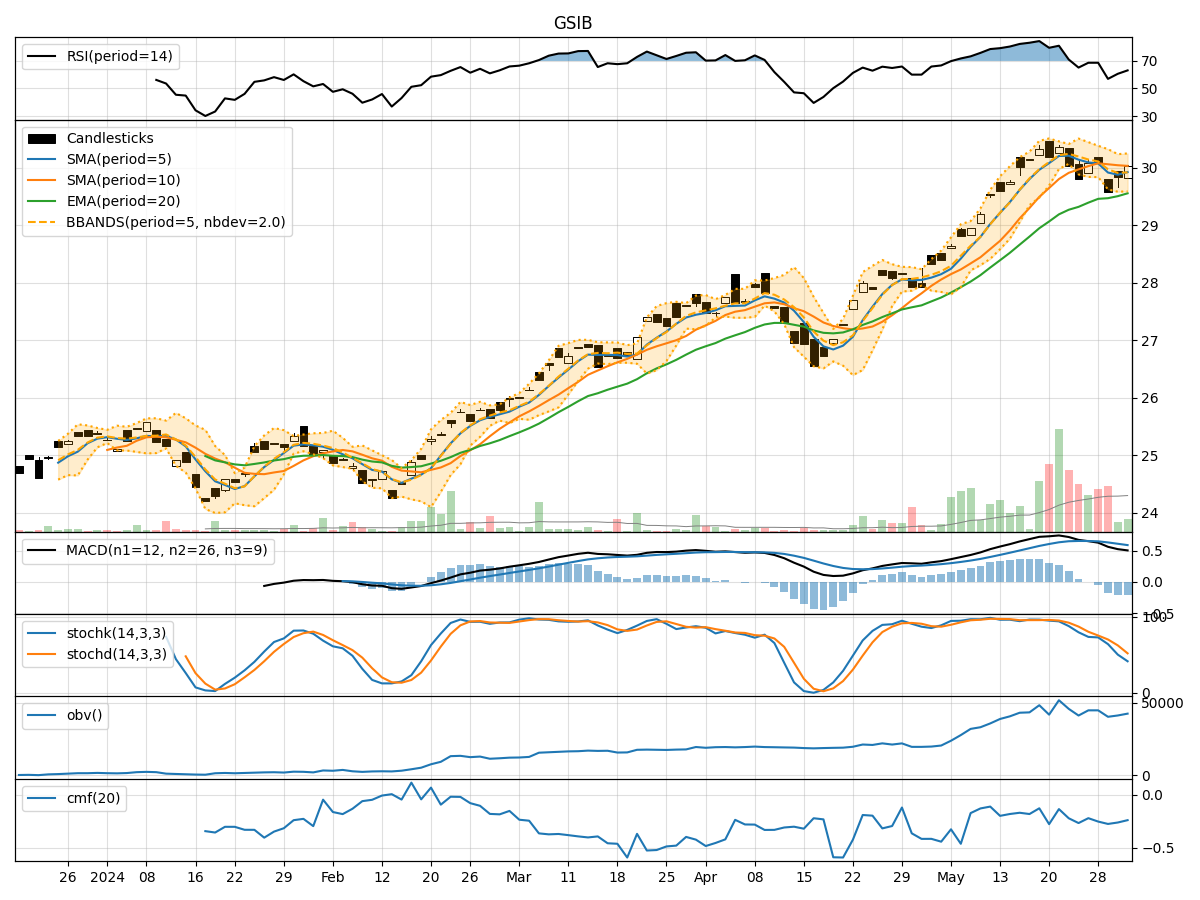
In analyzing the technical indicators for GSIB over the last 5 days, we will delve into the trend, momentum, volatility, and volume indicators to provide a comprehensive outlook on the possible stock price movement. By examining these key indicators, we aim to offer valuable insights and predictions for the upcoming days.
Trend Analysis:
- Moving Averages (MA): The 5-day Moving Average (MA) has been consistently rising, indicating a bullish trend in the short term.
- MACD: The MACD line has been above the signal line, suggesting positive momentum in the stock price.
- EMA: The Exponential Moving Average (EMA) has also been trending upwards, supporting the bullish sentiment.
Momentum Analysis:
- RSI: The Relative Strength Index (RSI) has been in the overbought territory, signaling a strong bullish momentum.
- Stochastic Oscillator: Both %K and %D have been in the overbought zone, indicating a potential reversal or consolidation.
- Williams %R: The Williams %R is also in the oversold region, suggesting a possible pullback.
Volatility Analysis:
- Bollinger Bands: The stock price has been trading near the upper Bollinger Band, indicating high volatility and a potential overbought condition.
- Bollinger Band Width: The Band Width has been expanding, suggesting increased price volatility.
- Bollinger Band %B: The %B indicator is above 0.8, indicating a potentially overbought market.
Volume Analysis:
- On-Balance Volume (OBV): The OBV has been increasing, reflecting positive buying pressure in the stock.
- Chaikin Money Flow (CMF): The CMF has been negative, indicating some selling pressure despite the rising OBV.
Conclusion:
Based on the analysis of the technical indicators, the stock of GSIB is currently exhibiting strong bullish momentum in the short term. However, the overbought conditions indicated by the RSI, Stochastic Oscillator, and Williams %R suggest a potential reversal or consolidation in the near future. The high volatility, as indicated by the Bollinger Bands and %B, also supports the likelihood of a pullback.
Therefore, considering the current technical outlook, it is advisable to exercise caution and monitor the stock closely for signs of a correction or consolidation. Traders may consider taking profits or implementing risk management strategies to navigate potential market fluctuations.