Technical Analysis of GSID 2024-05-10
Overview:
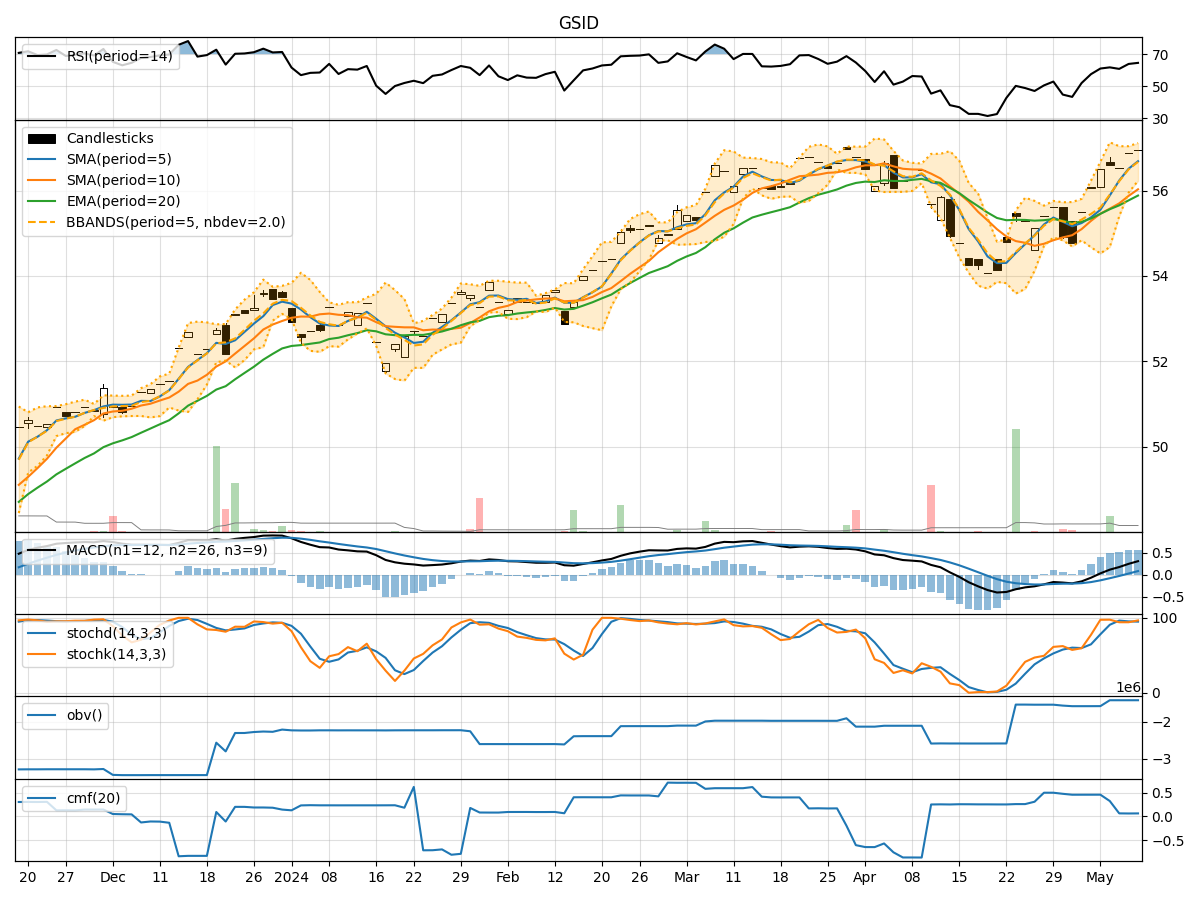
In analyzing the technical indicators for GSID over the last 5 days, we will delve into the trend, momentum, volatility, and volume indicators to provide a comprehensive outlook on the possible stock price movement in the coming days. By examining key metrics such as moving averages, MACD, RSI, Bollinger Bands, and volume trends, we aim to offer valuable insights and recommendations for potential trading strategies.
Trend Indicators:
- Moving Averages (MA): The 5-day moving average has been consistently above the simple moving average (SMA) and exponential moving average (EMA), indicating a bullish trend.
- MACD: The MACD line has been above the signal line, with both lines showing an upward trend, suggesting bullish momentum.
- MACD Histogram: The histogram has been increasing over the past 5 days, indicating strengthening bullish momentum.
Momentum Indicators:
- RSI: The Relative Strength Index (RSI) has been in the overbought territory, suggesting a strong bullish momentum.
- Stochastic Oscillator: Both %K and %D have been relatively high, indicating an overbought condition.
- Williams %R: The Williams %R has been consistently in the oversold region, signaling a potential reversal.
Volatility Indicators:
- Bollinger Bands: The stock price has been trading within the upper Bollinger Band, indicating an overbought condition.
- Bollinger Band Width: The band width has been narrowing, suggesting a decrease in volatility.
- Bollinger Band %B: The %B indicator has been above 0.8, indicating a potential overbought condition.
Volume Indicators:
- On-Balance Volume (OBV): The OBV has been increasing, reflecting positive buying pressure.
- Chaikin Money Flow (CMF): The CMF has been positive, indicating a bullish trend in money flow.
Key Observations and Opinions:
- Trend: The trend indicators suggest a strong bullish sentiment in the stock price.
- Momentum: Momentum indicators point towards an overbought condition, signaling a potential reversal or consolidation.
- Volatility: Volatility indicators show a decrease in volatility, possibly leading to a period of consolidation.
- Volume: Volume indicators reflect positive buying pressure, supporting the bullish trend.
Conclusion:
Based on the analysis of the technical indicators, the next few days' possible stock price movement for GSID is likely to experience a consolidation phase or a minor pullback due to the overbought conditions indicated by the momentum indicators. However, the overall trend remains bullish, supported by strong buying pressure and positive money flow. Traders may consider taking profits or waiting for a potential dip to enter long positions. It is essential to monitor key support and resistance levels for potential entry and exit points.