Technical Analysis of GTEK 2024-05-10
Overview:
In analyzing the technical indicators for GTEK over the last 5 days, we will delve into the trend, momentum, volatility, and volume indicators to provide a comprehensive outlook on the possible stock price movement in the coming days.
Trend Analysis:
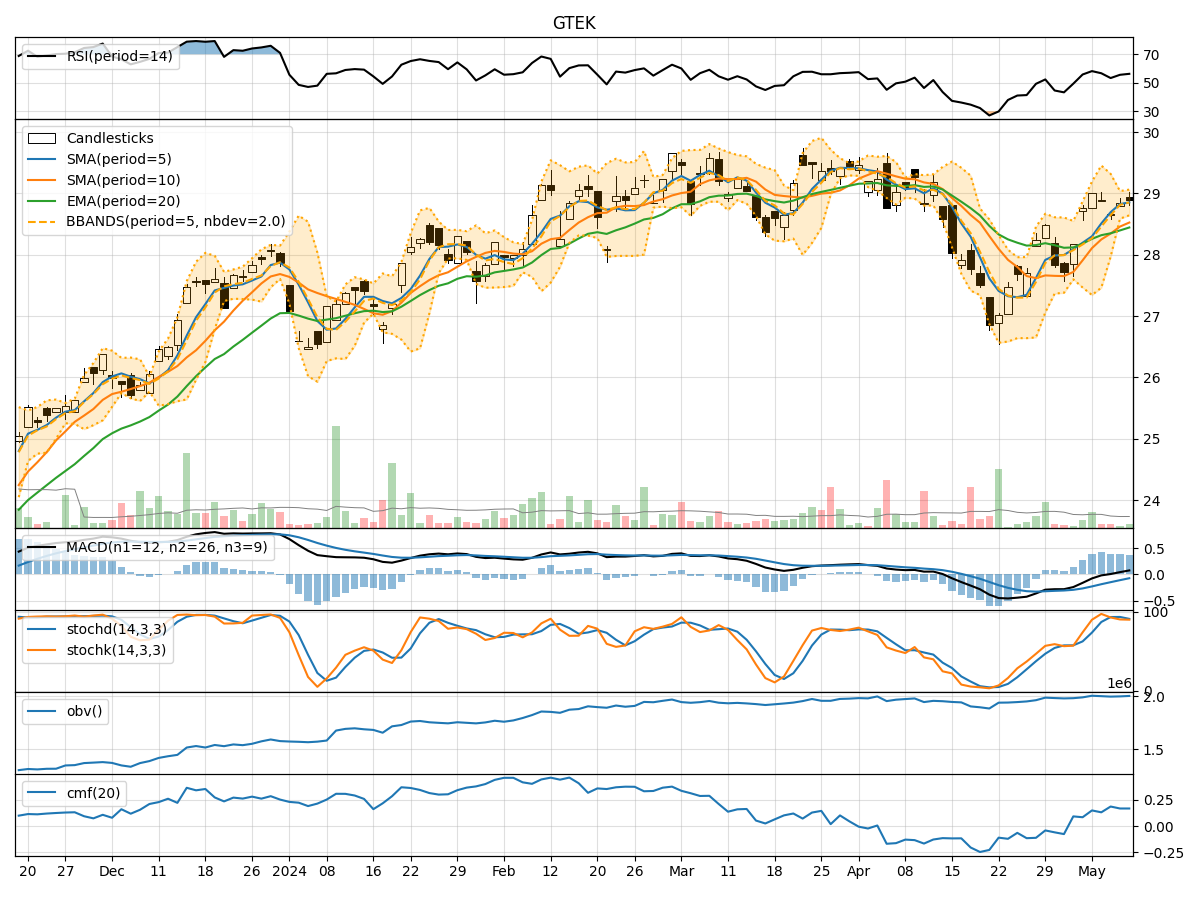
- Moving Averages (MA): The 5-day Moving Average (MA) has been consistently above the Simple Moving Average (SMA) and Exponential Moving Average (EMA), indicating a short-term bullish trend.
- MACD: The MACD line has been consistently above the signal line, with both lines trending upwards, suggesting a bullish momentum in the stock price.
- RSI: The Relative Strength Index (RSI) has been fluctuating around the 50 level, indicating a neutral stance in terms of momentum.
Momentum Analysis:
- Stochastic Oscillator: The Stochastic Oscillator has been hovering in the overbought territory, suggesting a potential reversal or consolidation phase.
- Williams %R: The Williams %R indicator has been consistently below -20, indicating an overbought condition and a possible upcoming correction.
Volatility Analysis:
- Bollinger Bands (BB): The Bollinger Bands have been narrowing, indicating decreasing volatility in the stock price.
- Average True Range (ATR): The ATR has been relatively stable, suggesting a lack of significant price fluctuations.
Volume Analysis:
- On-Balance Volume (OBV): The OBV has shown a slight increase over the last 5 days, indicating some accumulation by investors.
- Chaikin Money Flow (CMF): The CMF has been positive, suggesting buying pressure in the stock.
Key Observations:
- The trend indicators point towards a bullish sentiment in the short term.
- Momentum indicators signal a potential reversal or consolidation phase due to overbought conditions.
- Volatility indicators suggest decreasing price fluctuations.
- Volume indicators indicate some accumulation and buying pressure.
Conclusion:
Based on the analysis of the technical indicators, the next few days' possible stock price movement for GTEK is likely to experience a consolidation phase or a minor correction after the recent bullish trend. Traders should be cautious of the overbought conditions highlighted by the momentum indicators and the narrowing Bollinger Bands indicating decreased volatility. It is advisable to closely monitor the price action and volume dynamics for potential entry or exit points in the stock.