Technical Analysis of GTIP 2024-05-10
Overview:
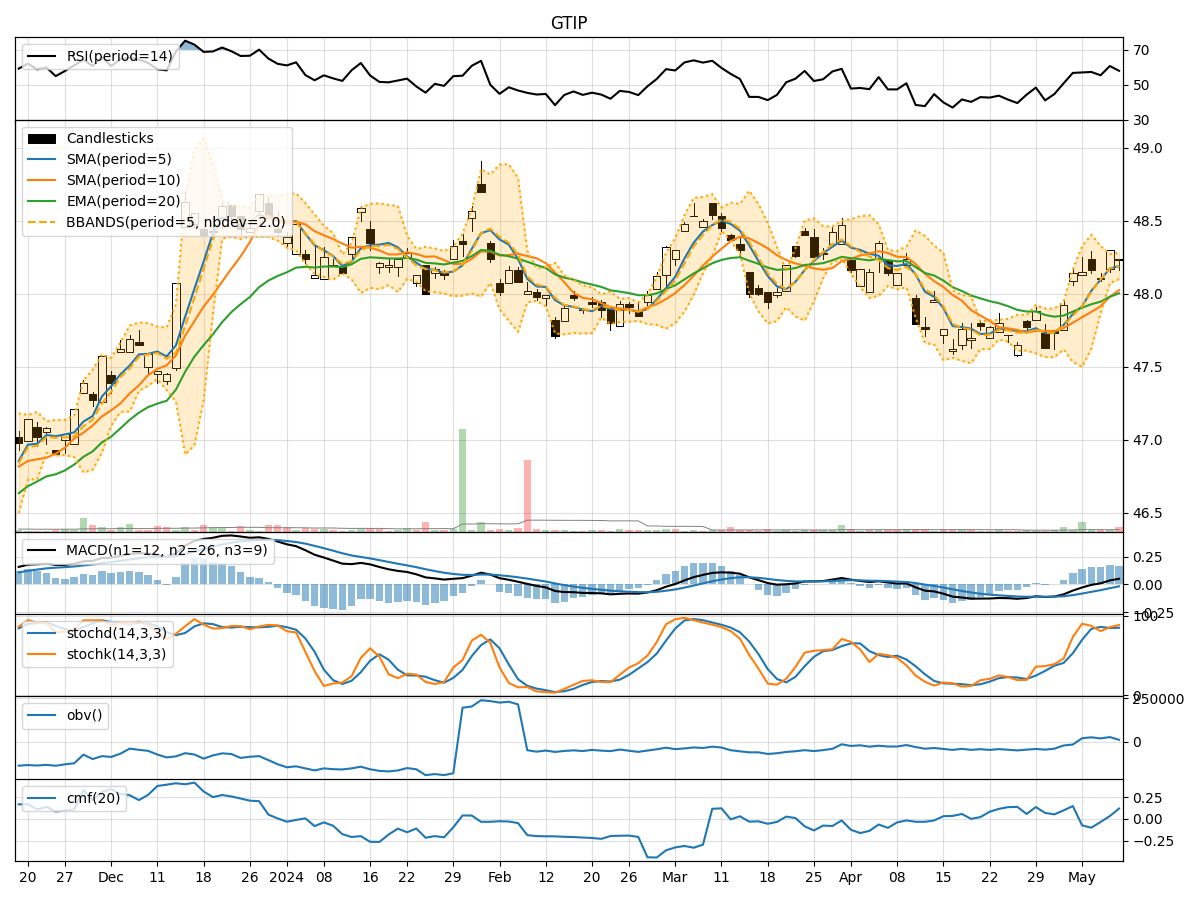
In the last 5 trading days, GTIP stock has shown relatively stable price movements with a slight upward trend. The technical indicators suggest a mixed outlook with some indicators pointing towards bullish momentum while others indicate potential consolidation. Let's delve deeper into each category of indicators to provide a comprehensive analysis and make a prediction for the next few days.
Trend Indicators:
- Moving Averages (MA): The 5-day Moving Average (MA) has been consistently above the closing prices, indicating a short-term uptrend.
- MACD: The MACD line has been positive, suggesting bullish momentum, but the MACD Histogram has been decreasing, signaling a potential slowdown in the uptrend.
- EMA: The Exponential Moving Average (EMA) has been trending upwards, supporting the bullish sentiment.
Momentum Indicators:
- RSI: The Relative Strength Index (RSI) has been fluctuating around the overbought territory, indicating a strong bullish momentum.
- Stochastic Oscillator: Both %K and %D have been in the overbought zone, suggesting a potential reversal or consolidation.
- Williams %R: The Williams %R is in the oversold region, indicating a possible reversal in the short term.
Volatility Indicators:
- Bollinger Bands (BB): The stock price has been trading within the Bollinger Bands, suggesting a period of consolidation. The bands are relatively narrow, indicating low volatility.
- Bollinger %B: The %B indicator is hovering around the middle, indicating a balanced market sentiment.
Volume Indicators:
- On-Balance Volume (OBV): The OBV has been relatively flat, indicating a balance between buying and selling pressure.
- Chaikin Money Flow (CMF): The CMF has been negative, suggesting some distribution in the stock.
Key Observations:
- The trend indicators show a mixed outlook with a slight bullish bias.
- Momentum indicators suggest a strong bullish sentiment but also hint at potential overbought conditions.
- Volatility indicators point towards a period of consolidation with low volatility.
- Volume indicators indicate a balanced market sentiment with a slight negative bias.
Conclusion:
Based on the analysis of the technical indicators, the next few days for GTIP stock are likely to see sideways movement or consolidation. The stock may trade within a narrow range as it digests the recent price movements. Traders should exercise caution as the stock is showing signs of potential reversal or consolidation in the short term. It is advisable to wait for clearer signals before making significant trading decisions.