Technical Analysis of GTR 2024-05-10
Overview:
In analyzing the technical indicators for GTR stock over the last 5 days, we will delve into the trend, momentum, volatility, and volume indicators to provide a comprehensive outlook on the possible future stock price movement. By examining these key indicators, we aim to offer valuable insights and recommendations for potential investors.
Trend Indicators:
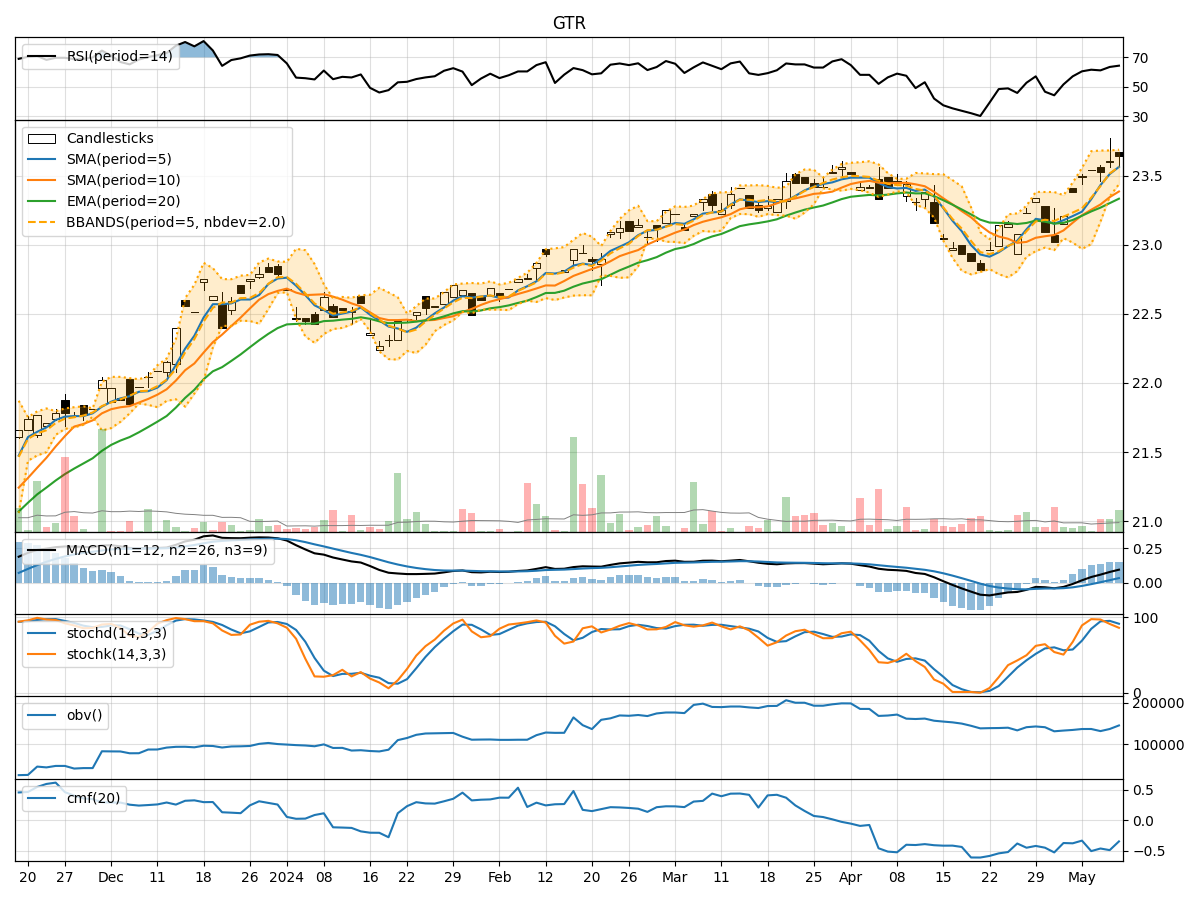
- Moving Averages (MA): The 5-day moving average has been consistently above the simple moving average (SMA) and exponential moving average (EMA), indicating a bullish trend.
- MACD: The MACD line has been consistently above the signal line, suggesting positive momentum in the stock price.
- MACD Histogram: The histogram has been increasing over the last 5 days, indicating strengthening bullish momentum.
Momentum Indicators:
- RSI: The Relative Strength Index (RSI) has been in the range of 60-65, indicating a moderate level of buying pressure.
- Stochastic Oscillator: Both %K and %D have been fluctuating in the overbought territory, suggesting a potential reversal or consolidation.
- Williams %R: The Williams %R has been hovering around -15 to -20, indicating an overbought condition.
Volatility Indicators:
- Bollinger Bands: The stock price has been trading within the upper Bollinger Band, suggesting an overbought condition.
- Bollinger Band Width: The band width has been narrowing, indicating decreasing volatility in the stock price.
Volume Indicators:
- On-Balance Volume (OBV): The OBV has shown mixed signals with fluctuations, indicating indecision among investors.
- Chaikin Money Flow (CMF): The CMF has been consistently negative, suggesting selling pressure in the stock.
Key Observations and Opinions:
- Trend: The trend indicators point towards a bullish sentiment in the stock price.
- Momentum: The momentum indicators suggest a potential reversal or consolidation due to overbought conditions.
- Volatility: The narrowing Bollinger Bands and decreasing volatility indicate a possible period of consolidation.
- Volume: The mixed signals in volume indicators reflect uncertainty among investors.
Conclusion:
Based on the analysis of the technical indicators, the next few days' possible stock price movement for GTR is likely to experience a sideways consolidation phase. The bullish trend may face resistance due to overbought momentum and decreasing volatility. Investors should exercise caution and monitor the price action closely for potential entry or exit points.