Technical Analysis of GURU 2024-05-10
Overview:
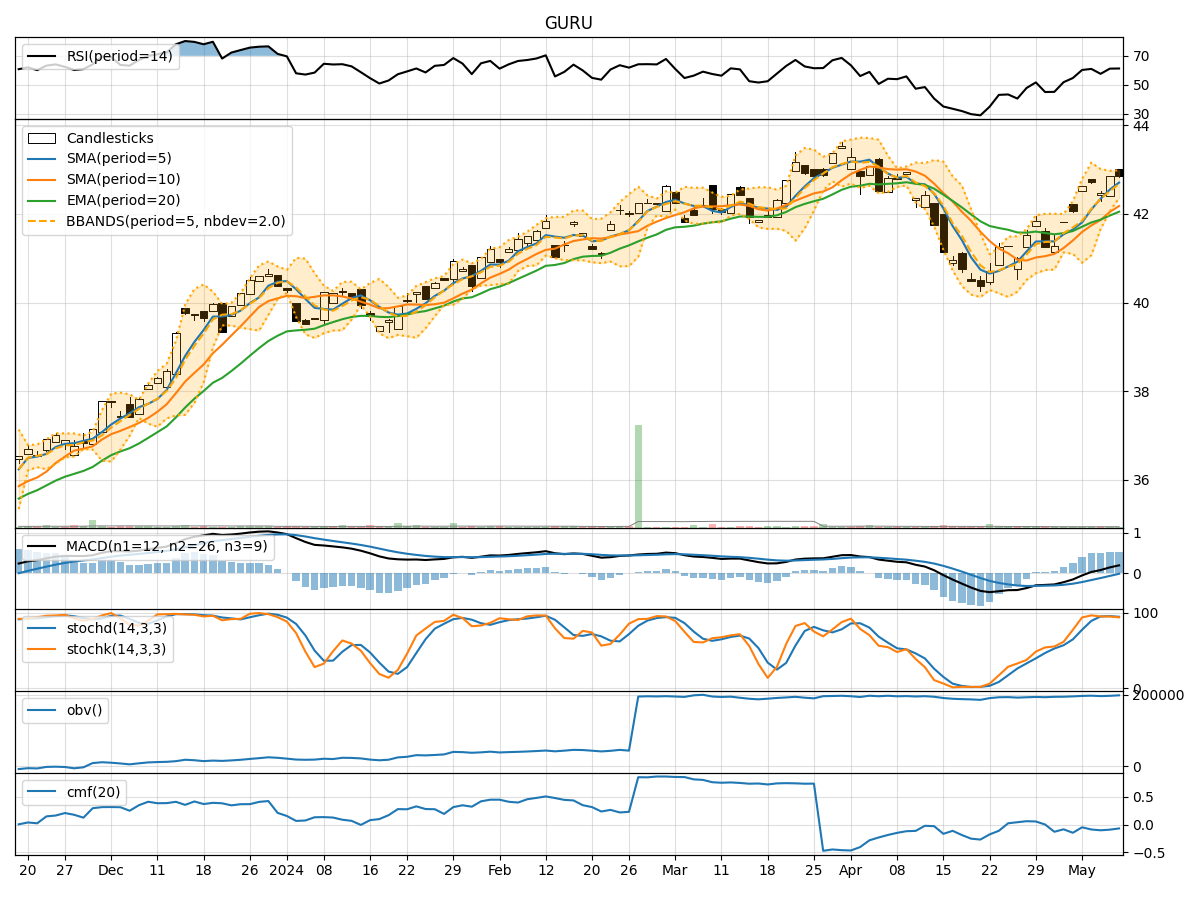
In analyzing the technical indicators for GURU stock over the last 5 days, we will delve into the trend, momentum, volatility, and volume indicators to provide a comprehensive outlook on the possible stock price movement in the coming days.
Trend Indicators:
- Moving Averages (MA): The 5-day Moving Average has been consistently above the Simple Moving Average (SMA) and Exponential Moving Average (EMA), indicating a bullish trend.
- MACD: The MACD line has been consistently above the signal line, with both lines showing an upward trend, suggesting bullish momentum.
- MACD Histogram: The MACD Histogram has been increasing over the last 5 days, indicating strengthening bullish momentum.
Momentum Indicators:
- RSI: The Relative Strength Index (RSI) has been in the overbought territory above 70, indicating a strong bullish momentum.
- Stochastic Oscillator: Both %K and %D lines of the Stochastic Oscillator have been in the overbought zone, suggesting a potential reversal or consolidation.
- Williams %R: The Williams %R has been fluctuating around the oversold territory, indicating potential buying opportunities.
Volatility Indicators:
- Bollinger Bands: The stock price has been trading within the Bollinger Bands, with the bands narrowing, suggesting a period of consolidation or reduced volatility.
- Bollinger %B: The %B indicator has been hovering around 0.8, indicating that the stock price is closer to the upper band, potentially signaling an overbought condition.
Volume Indicators:
- On-Balance Volume (OBV): The OBV has been fluctuating, indicating mixed buying and selling pressure.
- Chaikin Money Flow (CMF): The CMF has been negative, suggesting a lack of buying pressure in the stock.
Key Observations:
- The trend indicators suggest a strong bullish trend in the stock.
- Momentum indicators indicate overbought conditions, potentially signaling a need for a pullback or consolidation.
- Volatility indicators point towards a period of consolidation or reduced volatility.
- Volume indicators show mixed signals with no clear direction in buying or selling pressure.
Conclusion:
Based on the analysis of the technical indicators, the stock price of GURU is likely to experience a short-term pullback or consolidation in the coming days. The strong bullish trend may see a temporary pause as the momentum indicators signal overbought conditions. Traders should be cautious of a potential reversal or sideways movement in the stock price. It is advisable to monitor the price action closely for any signs of a trend reversal or continuation before making any trading decisions.