Technical Analysis of GVI 2024-05-10
Overview:
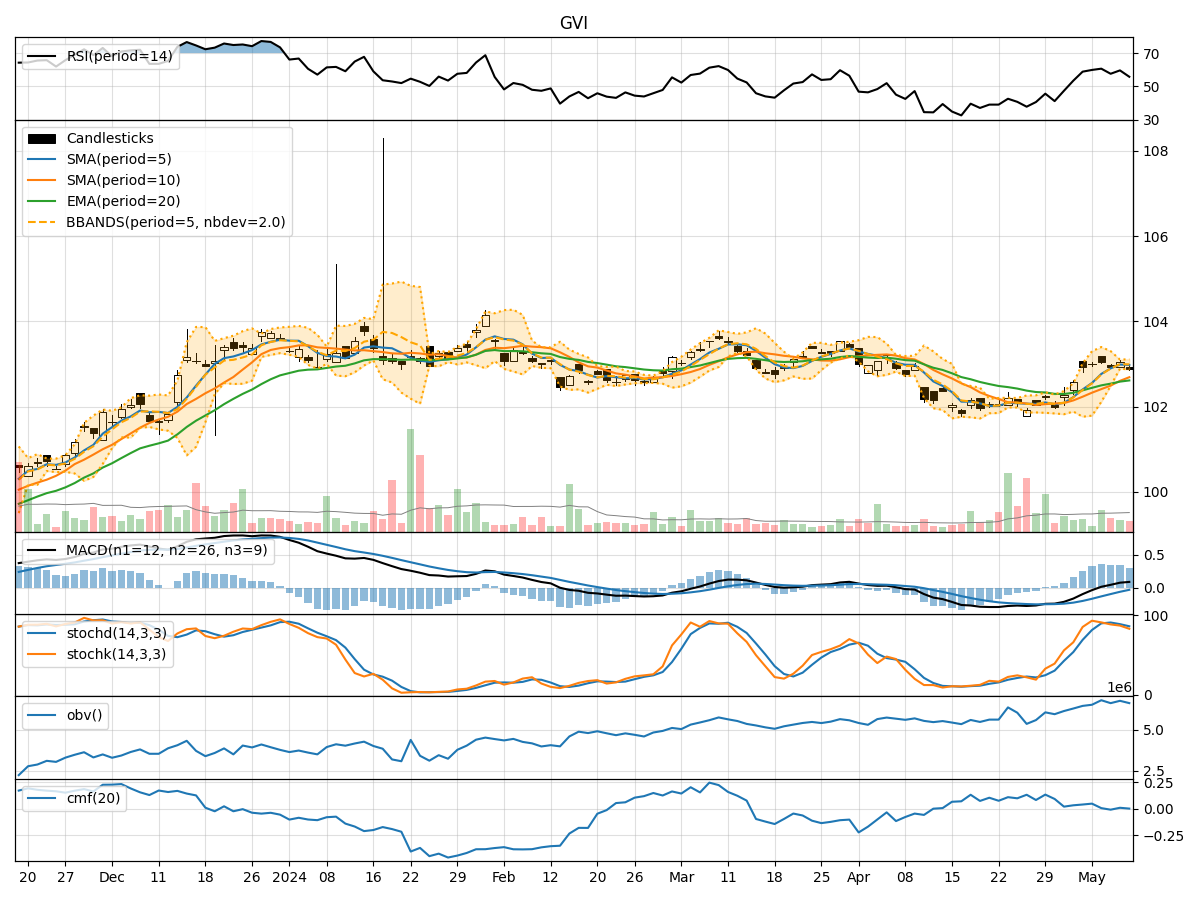
In analyzing the technical indicators for GVI stock over the last 5 days, we will delve into the trend, momentum, volatility, and volume indicators to provide a comprehensive outlook on the possible stock price movement in the coming days. By examining these key indicators, we aim to offer valuable insights and predictions for potential investors.
Trend Indicators:
- Moving Averages (MA): The 5-day moving average has been consistently above the simple moving average (SMA) and exponential moving average (EMA), indicating a short-term uptrend.
- MACD: The MACD line has been consistently above the signal line, suggesting bullish momentum in the stock price.
- MACD Histogram: The MACD histogram has been gradually decreasing but remains in positive territory, indicating a potential slowdown in bullish momentum.
Momentum Indicators:
- RSI: The Relative Strength Index (RSI) has been fluctuating around the 50 level, indicating a neutral momentum in the stock.
- Stochastic Oscillator: Both %K and %D lines of the stochastic oscillator have been declining, signaling a potential bearish momentum shift.
- Williams %R: The Williams %R indicator has been consistently in oversold territory, suggesting a possible reversal in the stock price.
Volatility Indicators:
- Bollinger Bands: The stock price has been trading within the Bollinger Bands, with the bands narrowing, indicating decreasing volatility.
- Bollinger %B: The %B indicator has been hovering around the midpoint, suggesting a balanced market sentiment.
Volume Indicators:
- On-Balance Volume (OBV): The OBV indicator has been relatively flat, indicating a lack of significant buying or selling pressure.
- Chaikin Money Flow (CMF): The CMF has been close to zero, reflecting a neutral money flow in the stock.
Key Observations and Opinions:
- Trend: The stock is currently in an upward trend based on moving averages and MACD analysis.
- Momentum: Momentum indicators suggest a neutral to bearish bias with potential for a reversal.
- Volatility: Volatility has been decreasing, indicating a possible period of consolidation.
- Volume: Volume indicators show limited buying or selling pressure in the stock.
Conclusion:
Based on the analysis of the technical indicators, the next few days for GVI stock are likely to see sideways movement or consolidation. Investors should closely monitor key support and resistance levels for potential breakout or breakdown scenarios. It is advisable to wait for clearer signals from the indicators before making significant trading decisions.