Technical Analysis of GVLU 2024-05-10
Overview:
In analyzing the technical indicators for GVLU stock over the last 5 days, we will delve into the trend, momentum, volatility, and volume indicators to provide a comprehensive outlook on the possible stock price movement in the coming days. By examining these key indicators, we aim to offer valuable insights and predictions to guide your investment decisions.
Trend Analysis:
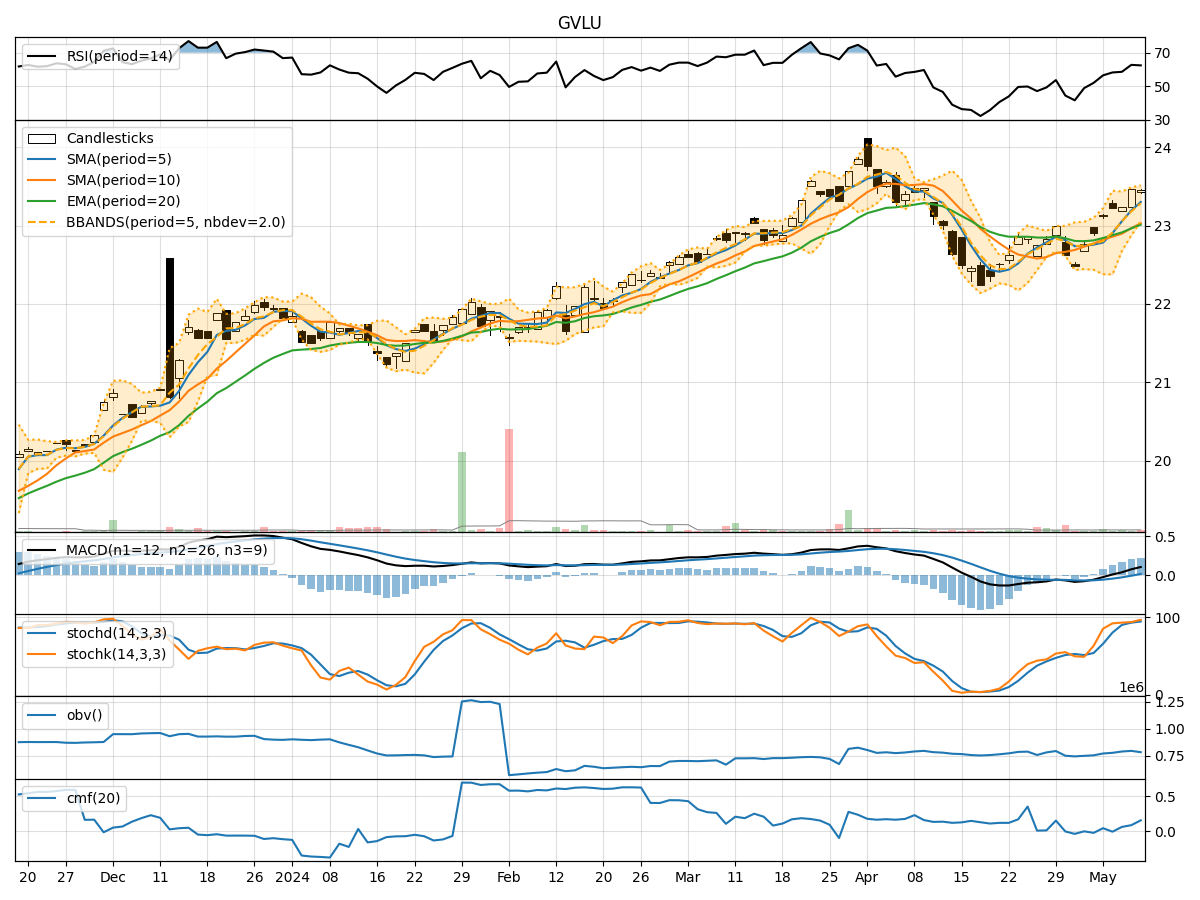
- Moving Averages (MA): The 5-day MA has been consistently above the closing prices, indicating a bullish trend.
- MACD: The MACD line has been above the signal line, suggesting a bullish momentum.
- Relative Strength Index (RSI): RSI has been in the neutral to slightly overbought territory, indicating a balanced market sentiment.
Key Observation: The trend indicators point towards a bullish sentiment in the stock price movement.
Momentum Analysis:
- Stochastic Oscillator: Both %K and %D have been in the overbought zone, signaling a potential reversal.
- Williams %R (WillR): The indicator has been hovering around oversold levels, suggesting a possible buying opportunity.
Key Observation: Momentum indicators show conflicting signals with stochastic oscillator indicating a potential reversal while Williams %R suggests a buying opportunity.
Volatility Analysis:
- Bollinger Bands (BB): The stock price has been trading within the bands, indicating normal volatility.
- Bollinger %B (BBP): The %B has been fluctuating within the bands, reflecting price movements within expected ranges.
Key Observation: Volatility indicators suggest that the stock price is currently experiencing normal fluctuations within the Bollinger Bands.
Volume Analysis:
- On-Balance Volume (OBV): The OBV has shown a slight increase, indicating buying pressure.
- Chaikin Money Flow (CMF): CMF has been positive, suggesting a healthy inflow of money into the stock.
Key Observation: Volume indicators point towards a positive sentiment with increasing buying pressure and money flow into the stock.
Conclusion:
Based on the analysis of the technical indicators, the stock price of GVLU is likely to experience a continuation of the bullish trend in the coming days. Despite some conflicting signals in the momentum indicators, the overall trend, supported by positive volume and volatility indicators, indicates a potential upward movement in the stock price. Investors may consider buying opportunities in GVLU stock based on the current technical analysis.
Key Conclusion: Bullish sentiment with a potential upward movement in the stock price.