Technical Analysis of GVUS 2024-05-10
Overview:
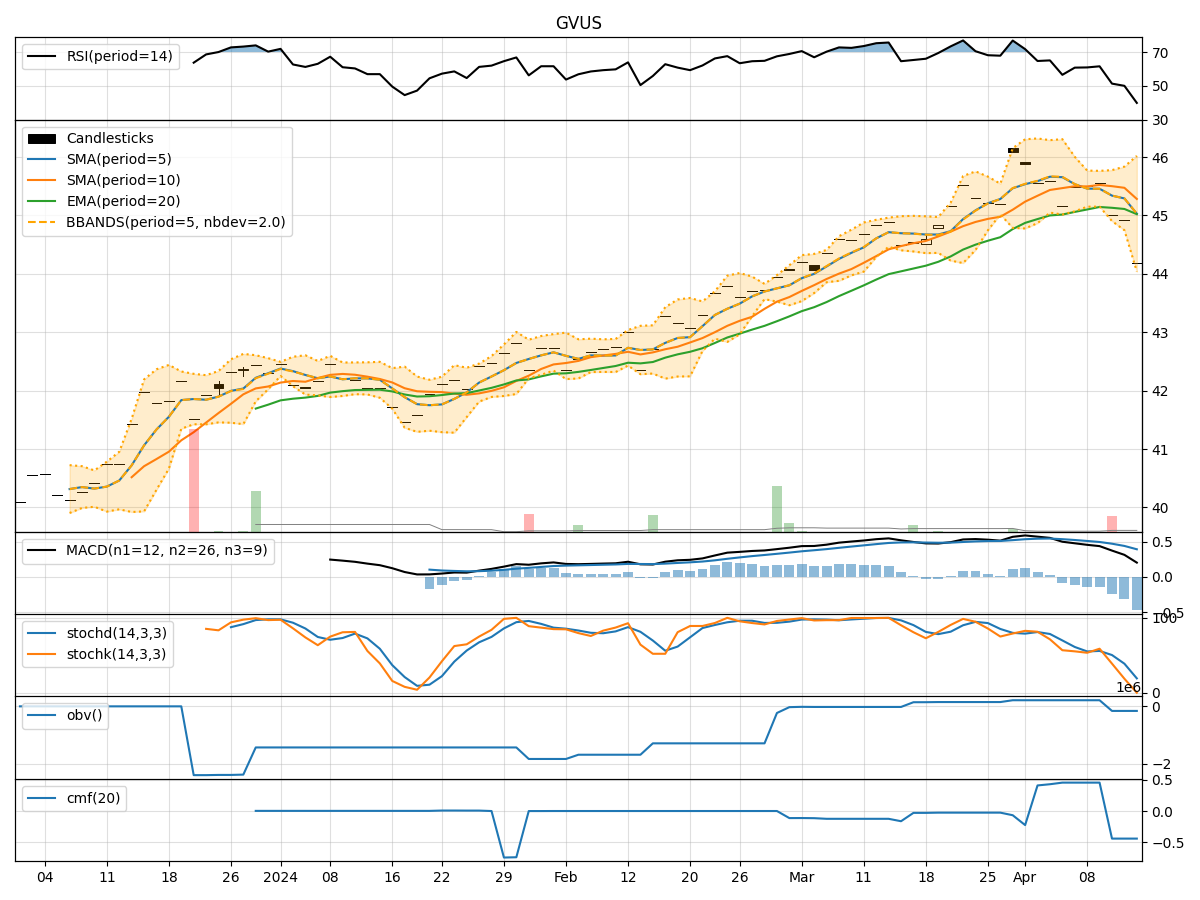
In analyzing the technical indicators for GVUS over the last 5 days, we will delve into the trend, momentum, volatility, and volume indicators to provide a comprehensive outlook on the possible stock price movement in the coming days.
Trend Indicators:
- Moving Averages (MA): The 5-day MA has been consistently above the closing prices, indicating a short-term uptrend.
- MACD: The MACD line has been consistently above the signal line, suggesting bullish momentum.
- EMA: The EMA has been trending upwards, reflecting a positive price trend.
Momentum Indicators:
- RSI: The RSI has been increasing, indicating strengthening bullish momentum.
- Stochastic Oscillator: Both %K and %D have been in the overbought zone, suggesting a potential reversal or consolidation.
- Williams %R: The indicator has been hovering around the oversold territory, signaling a possible buying opportunity.
Volatility Indicators:
- Bollinger Bands (BB): The stock price has been trading within the bands, indicating normal volatility.
- BB Width: The width of the bands has been relatively stable, suggesting consistent price movement.
- BB %B: The %B indicator has been fluctuating within a normal range, reflecting typical price action.
Volume Indicators:
- On-Balance Volume (OBV): The OBV has been relatively flat, indicating a balance between buying and selling pressure.
- Chaikin Money Flow (CMF): The CMF has shown a slight positive trend, suggesting some accumulation.
Key Observations and Opinions:
- Trend: The trend indicators suggest a bullish bias in the short term.
- Momentum: Momentum indicators show a mix of bullish and potential reversal signals.
- Volatility: Volatility indicators point to stable price movements.
- Volume: Volume indicators indicate a neutral stance with a slight accumulation bias.
Conclusion:
Based on the analysis of the technical indicators, the next few days for GVUS could see further upside potential in the stock price. The trend remains upward, supported by bullish momentum and stable volatility. However, caution is advised as some momentum indicators hint at a possible reversal or consolidation in the near term. Traders should closely monitor key support and resistance levels for potential entry and exit points.