Technical Analysis of GWX 2024-05-10
Overview:
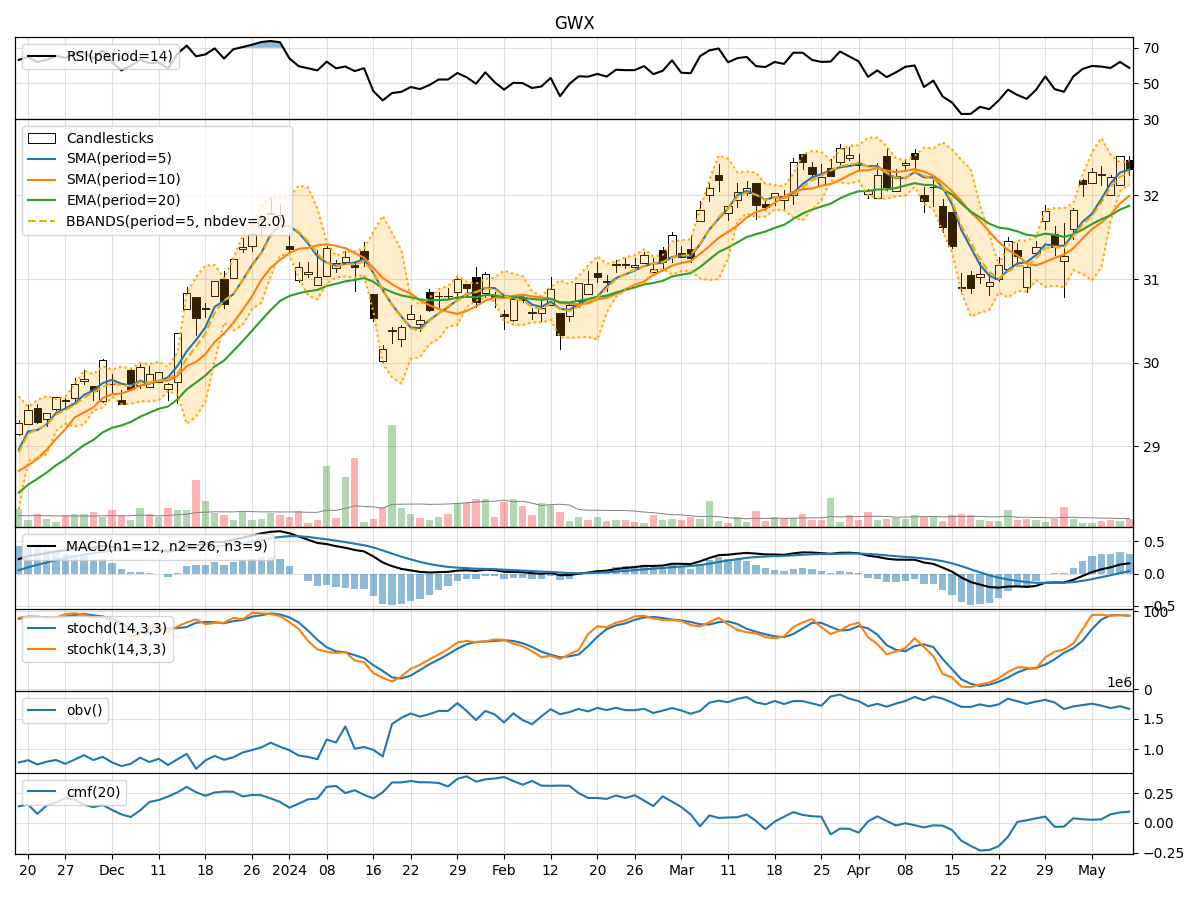
In analyzing the technical indicators for GWX over the last 5 days, we will delve into the trend, momentum, volatility, and volume indicators to provide a comprehensive outlook on the possible stock price movement in the coming days.
Trend Analysis:
- Moving Averages (MA): The 5-day Moving Average (MA) has been consistently above the Simple Moving Average (SMA) and Exponential Moving Average (EMA), indicating a bullish trend.
- MACD: The MACD line has been consistently above the signal line, suggesting a bullish momentum in the stock price.
- RSI: The Relative Strength Index (RSI) has been fluctuating around the 60-65 range, indicating a neutral to slightly bullish sentiment.
Momentum Analysis:
- Stochastic Oscillator: The Stochastic Oscillator has been hovering around the overbought territory, suggesting a potential reversal or consolidation in the stock price.
- Williams %R: The Williams %R indicator has been consistently in the oversold territory, indicating a bearish sentiment.
Volatility Analysis:
- Bollinger Bands: The Bollinger Bands have been relatively narrow, indicating low volatility in the stock price movement.
- Average True Range (ATR): The ATR has been relatively stable, further confirming the low volatility environment.
Volume Analysis:
- On-Balance Volume (OBV): The OBV indicator has shown mixed signals, with fluctuations in volume accumulation.
- Chaikin Money Flow (CMF): The CMF has been gradually increasing, indicating a potential inflow of money into the stock.
Key Observations:
- The trend indicators suggest a bullish bias in the short term.
- Momentum indicators show conflicting signals, with stochastic indicating a potential reversal and Williams %R signaling bearishness.
- Volatility remains low, indicating a lack of significant price fluctuations.
- Volume indicators show mixed signals, with OBV fluctuating and CMF showing a positive trend.
Conclusion:
Based on the analysis of the technical indicators, the next few days' possible stock price movement for GWX is likely to be sideways with a slight bullish bias. Traders should exercise caution due to conflicting signals from momentum indicators and the potential for a consolidation phase. It is advisable to closely monitor key support and resistance levels for potential entry and exit points in the stock.