Technical Analysis of GXC 2024-05-10
Overview:
In analyzing the technical indicators for GXC over the last 5 days, we will delve into the trend, momentum, volatility, and volume indicators to provide a comprehensive outlook on the possible stock price movement in the coming days.
Trend Analysis:
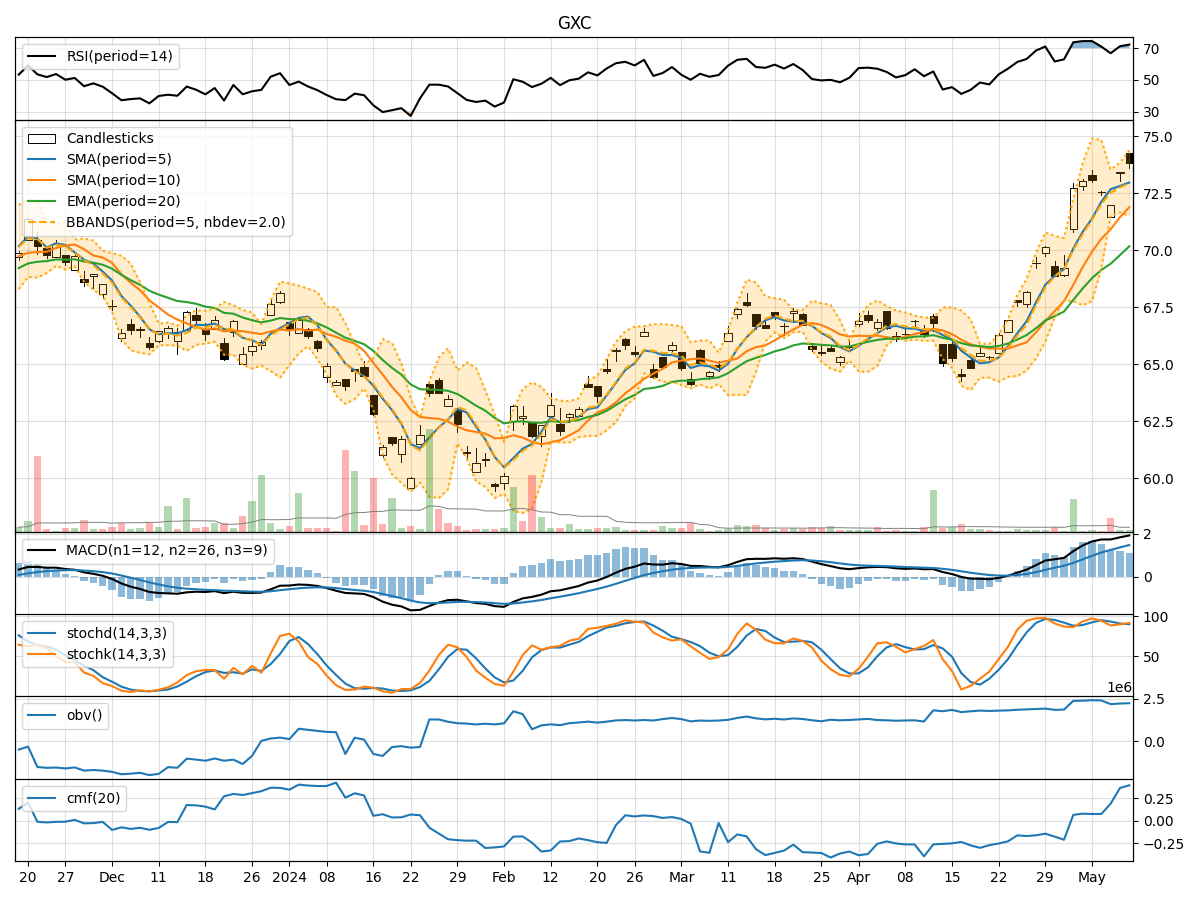
- Moving Averages (MA): The 5-day Moving Average (MA) has been consistently above the Simple Moving Average (SMA) and Exponential Moving Average (EMA), indicating a bullish trend.
- MACD: The MACD line has been above the signal line, with both lines showing an upward trend, suggesting bullish momentum.
Momentum Analysis:
- RSI: The Relative Strength Index (RSI) has been fluctuating but generally staying above 50, indicating bullish momentum.
- Stochastic Oscillator: Both %K and %D have been above 80, suggesting overbought conditions.
Volatility Analysis:
- Bollinger Bands (BB): The stock price has been consistently trading above the middle Bollinger Band (BBM), indicating an upward trend with low volatility.
Volume Analysis:
- On-Balance Volume (OBV): The OBV has been increasing over the last 5 days, indicating accumulation by investors.
- Chaikin Money Flow (CMF): The CMF has been positive, indicating buying pressure in the stock.
Key Observations:
- The trend indicators suggest a strong bullish sentiment in the stock.
- Momentum indicators show overbought conditions, which might lead to a potential pullback.
- Volatility remains low, indicating a stable uptrend.
- Volume indicators reflect positive accumulation and buying pressure.
Conclusion:
Based on the analysis of the technical indicators, the next few days' possible stock price movement for GXC is likely to continue in an upward direction. However, considering the overbought conditions indicated by the Stochastic Oscillator and the potential for a pullback, investors should be cautious of a short-term correction. It is advisable to monitor the price action closely for any signs of reversal or consolidation before making trading decisions.
Recommendation:
- Short-term: Consider taking profits or tightening stop-loss levels due to overbought conditions.
- Long-term: Hold positions with a bullish bias, but remain vigilant for any signs of trend reversal.
By combining technical analysis with market dynamics, investors can make informed decisions to navigate the stock market effectively.