Technical Analysis of GXTG 2024-05-10
Overview:
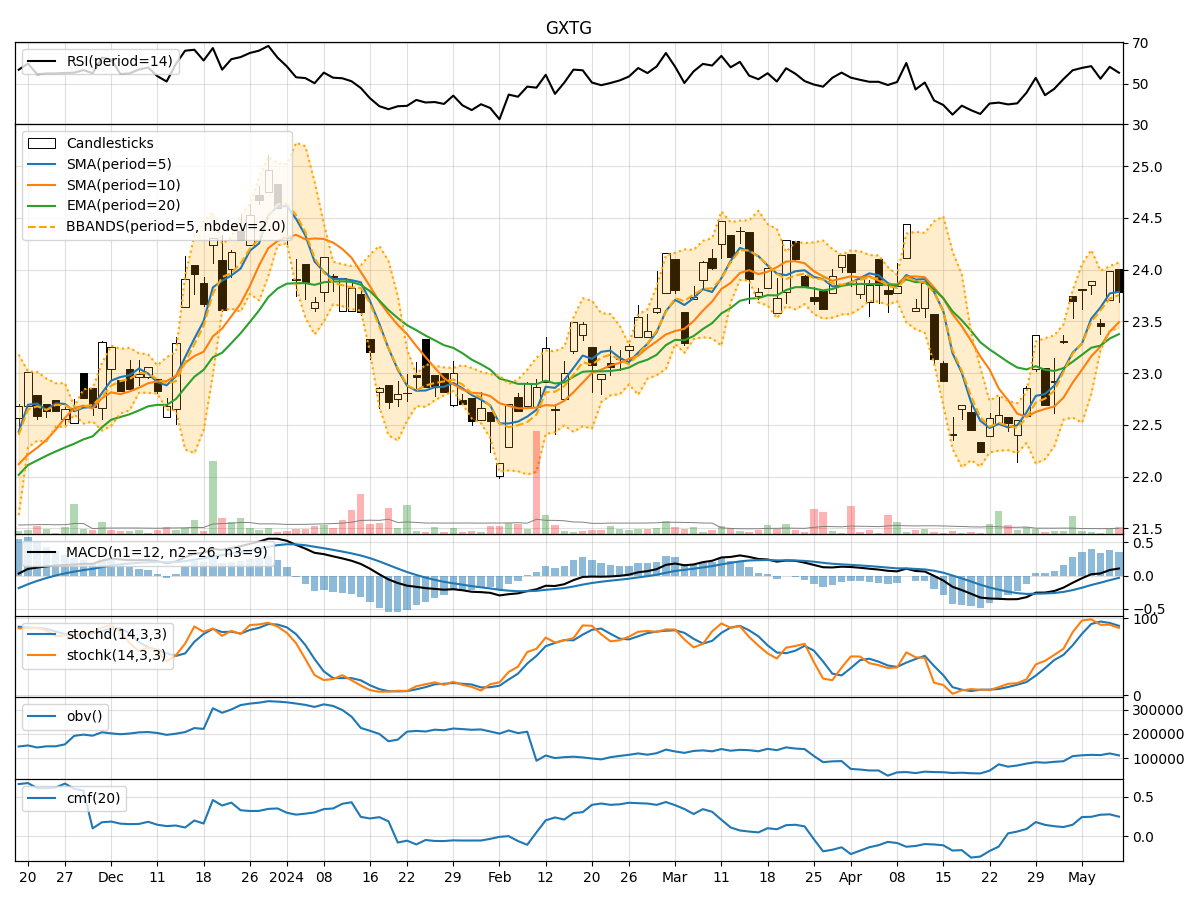
In analyzing the technical indicators for GXTG over the last 5 days, we will delve into the trend, momentum, volatility, and volume indicators to provide a comprehensive outlook on the possible stock price movement in the coming days. By examining these key aspects, we aim to offer valuable insights and predictions for informed decision-making.
Trend Analysis:
- Moving Averages (MA): The 5-day MA has been consistently above the closing prices, indicating a short-term uptrend.
- MACD: The MACD line has been consistently above the signal line, suggesting a bullish momentum.
- EMA: The EMA has been trending upwards, reflecting a positive momentum in the stock price.
Momentum Analysis:
- RSI: The RSI has been fluctuating around the 50 level, indicating a neutral momentum.
- Stochastic Oscillator: Both %K and %D have been gradually decreasing, signaling a potential reversal in momentum.
- Williams %R: The indicator has been hovering around oversold levels, suggesting a possible buying opportunity.
Volatility Analysis:
- Bollinger Bands: The stock price has been trading within the bands, indicating a period of consolidation.
- Bollinger %B: The %B indicator has been fluctuating around the midpoint, reflecting a balanced volatility.
- Average True Range (ATR): The ATR has been relatively stable, suggesting a consistent level of volatility in the stock.
Volume Analysis:
- On-Balance Volume (OBV): The OBV has been fluctuating, indicating mixed buying and selling pressure.
- Chaikin Money Flow (CMF): The CMF has been positive, suggesting a net inflow of money into the stock.
Key Observations:
- The trend indicators point towards a bullish sentiment with moving averages and MACD supporting an upward trajectory.
- Momentum indicators show a neutral stance with RSI around the midpoint and stochastic oscillators hinting at a potential reversal.
- Volatility remains stable with Bollinger Bands indicating a period of consolidation.
- Volume indicators suggest mixed activity with OBV fluctuating and CMF showing positive money flow.
Conclusion:
Based on the analysis of technical indicators, the stock price of GXTG is likely to experience further upward movement in the coming days. The bullish trend supported by moving averages and MACD, coupled with stable volatility and positive money flow, indicates a favorable outlook for the stock. Traders may consider buying opportunities in anticipation of a potential price increase.