Technical Analysis of GXUS 2024-05-10
Overview:
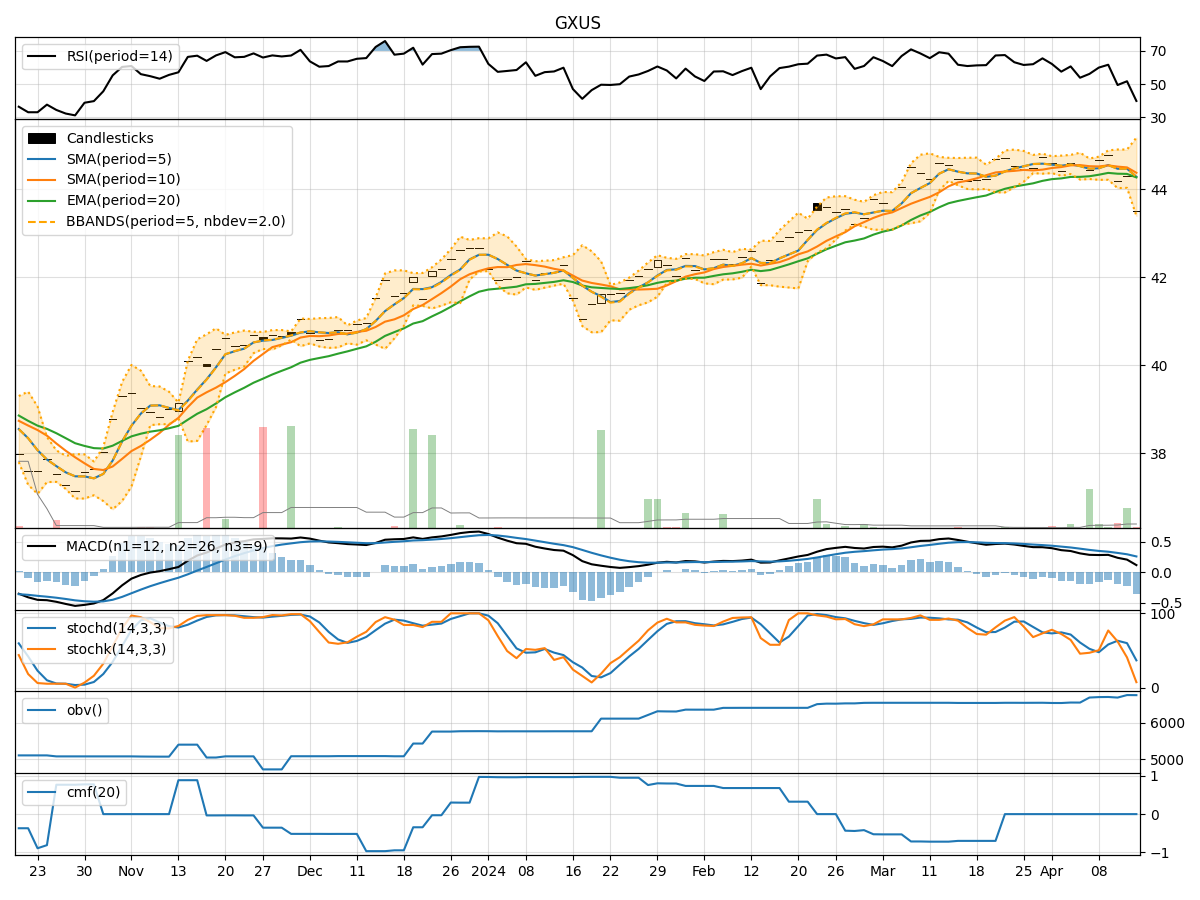
In analyzing the technical indicators for GXUS over the last 5 days, we will delve into the trend, momentum, volatility, and volume indicators to provide a comprehensive outlook on the possible stock price movement in the coming days. By examining these key indicators, we aim to offer valuable insights and predictions for potential investors.
Trend Analysis:
- Moving Averages (MA): The 5-day Moving Average (MA) has been consistently above the Simple Moving Average (SMA) and Exponential Moving Average (EMA), indicating a bullish trend.
- MACD: The MACD line has been consistently above the signal line, with both lines showing an upward trend, suggesting bullish momentum.
Momentum Analysis:
- RSI: The Relative Strength Index (RSI) has been fluctuating around the overbought territory, indicating strong buying pressure.
- Stochastic Oscillator: Both %K and %D have been hovering near the overbought zone, suggesting a potential reversal or consolidation.
Volatility Analysis:
- Bollinger Bands (BB): The stock price has been trading within the upper and lower Bollinger Bands, indicating a period of volatility and potential price expansion.
Volume Analysis:
- On-Balance Volume (OBV): The OBV has been relatively stable, suggesting a balance between buying and selling pressure.
- Chaikin Money Flow (CMF): The CMF has been negative, indicating a bearish money flow trend.
Key Observations:
- The trend indicators suggest a strong bullish sentiment in the short term.
- Momentum indicators show signs of potential overbought conditions, hinting at a possible correction or consolidation.
- Volatility remains elevated, indicating potential price swings in the near future.
- Volume indicators reflect a neutral stance with a slight bearish bias.
Conclusion:
Based on the analysis of the technical indicators, the stock price of GXUS is likely to experience further upward movement in the coming days, driven by the bullish trend and momentum. However, caution is advised as the momentum indicators signal potential overbought conditions, which could lead to a short-term correction or consolidation. Traders should closely monitor price action within the Bollinger Bands and be mindful of any shifts in volume dynamics. Overall, the outlook for GXUS remains bullish in the near term, but vigilance is essential to navigate potential market fluctuations.