Technical Analysis of HACK 2024-05-10
Overview:
In analyzing the technical indicators for the stock HACK over the last 5 days, we will delve into the trends, momentum, volatility, and volume indicators to provide a comprehensive outlook on the possible future stock price movement. By examining these key indicators, we aim to offer valuable insights and predictions for the upcoming trading days.
Trend Indicators:
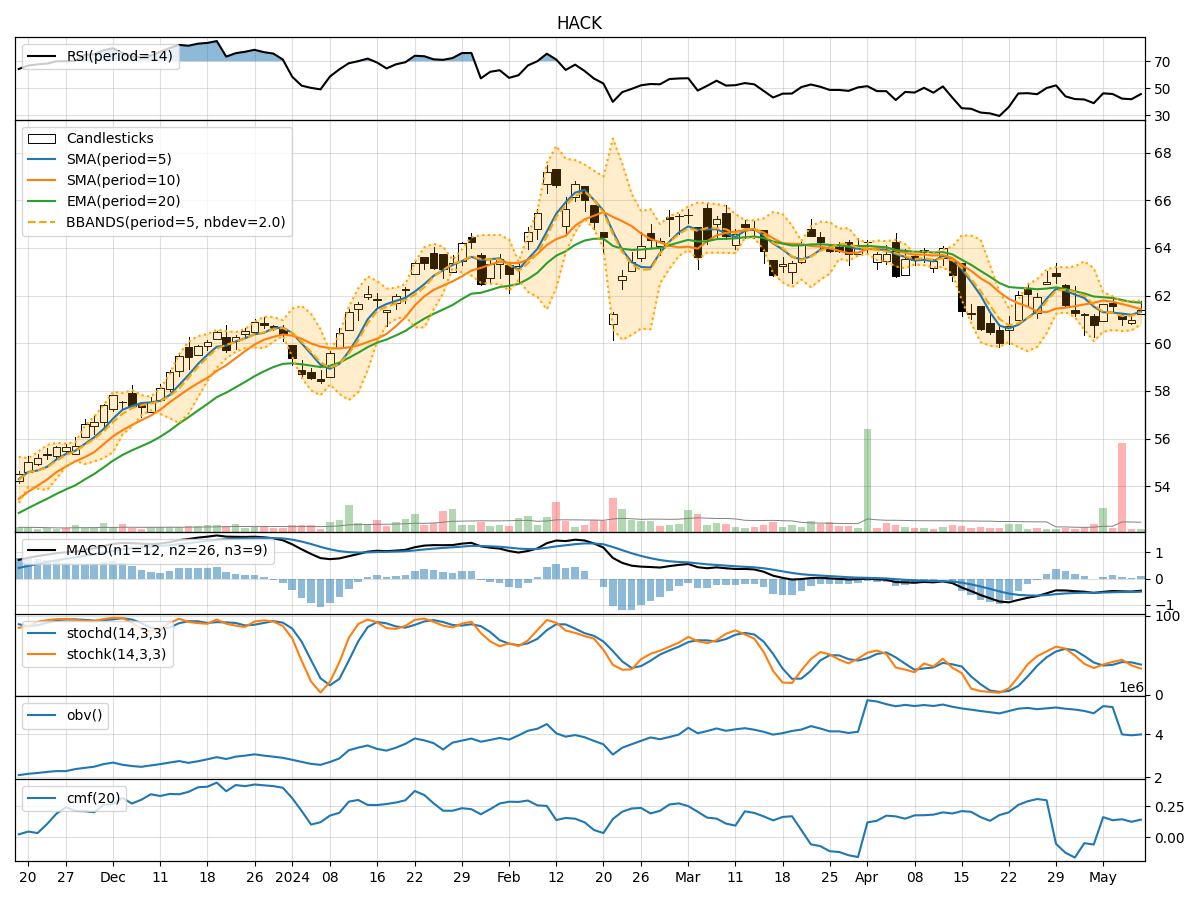
- Moving Averages (MA): The 5-day Moving Average (MA) has been fluctuating around the closing prices, indicating a relatively stable trend.
- MACD and Signal Line: The MACD has been negative but showing signs of convergence with the signal line, suggesting a potential shift in momentum.
- EMA: The Exponential Moving Average (EMA) has been slightly declining, indicating a bearish sentiment in the short term.
Key Observation: The trend indicators suggest a neutral to slightly bearish outlook for HACK in the short term.
Momentum Indicators:
- RSI: The Relative Strength Index (RSI) has been hovering around the mid-range, indicating a balanced momentum between buying and selling pressure.
- Stochastic Oscillator: Both %K and %D have been fluctuating, reflecting indecision in the market.
- Williams %R: The indicator has been in oversold territory, signaling a potential reversal in the near future.
Key Observation: Momentum indicators suggest a lack of clear direction, with a potential for a reversal in the coming days.
Volatility Indicators:
- Bollinger Bands: The bands have been narrowing, indicating decreasing volatility and a possible period of consolidation.
- Bollinger %B: The %B indicator has been fluctuating within a narrow range, reflecting a lack of strong momentum.
Key Observation: Volatility indicators point towards a period of consolidation and potential price stability in the short term.
Volume Indicators:
- On-Balance Volume (OBV): The OBV has shown mixed signals, with some days recording positive volume and others negative, suggesting uncertainty in investor sentiment.
- Chaikin Money Flow (CMF): The CMF has been relatively stable, indicating a balanced flow of money into and out of the stock.
Key Observation: Volume indicators reflect a lack of strong conviction among market participants, leading to mixed signals in trading volume.
Conclusion:
Based on the analysis of the technical indicators, the next few days for HACK are likely to see sideways movement with a slight bearish bias. The lack of clear trends in momentum, coupled with decreasing volatility and mixed volume signals, suggests a period of consolidation and indecision among investors. Traders should exercise caution and closely monitor key support and resistance levels for potential entry or exit points.
Key Takeaway:
- Overall Outlook: Sideways with a slight bearish bias
- Recommendation: Exercise caution and wait for clearer signals before making significant trading decisions.
- Monitoring: Keep a close eye on key support and resistance levels for potential breakout or breakdown scenarios.
By considering the interplay of trend, momentum, volatility, and volume indicators, traders can better navigate the market dynamics and make informed decisions in line with the prevailing market conditions.