Technical Analysis of HAP 2024-05-10
Overview:
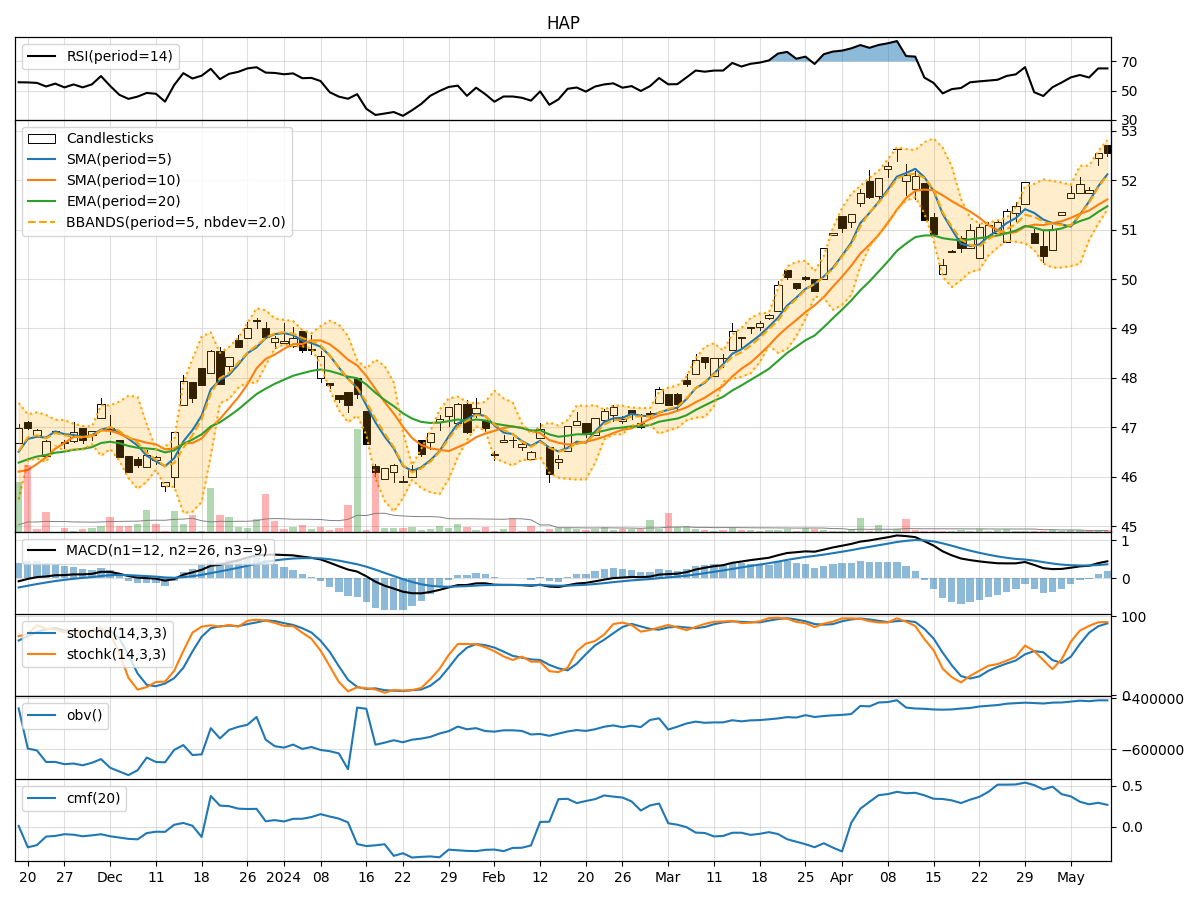
In the last 5 trading days, HAP stock has shown a consistent uptrend in terms of closing prices. The moving averages (MA) have been trending upwards, indicating a positive momentum. The Relative Strength Index (RSI) and Stochastic indicators suggest that the stock is in overbought territory, but the momentum remains strong. Volatility has been relatively stable, and volume has shown a slight increase.
Trend Analysis:
- Moving Averages (MA): The 5-day MA has been consistently above the 10-day Simple Moving Average (SMA) and 20-day Exponential Moving Average (EMA), indicating a bullish trend.
- MACD: The MACD line has been above the signal line for the past 5 days, with both lines trending upwards, suggesting a continuation of the bullish momentum.
Momentum Analysis:
- RSI: The RSI has been above 50 for all 5 days, indicating bullish momentum. However, it is approaching overbought levels, which could signal a potential reversal.
- Stochastic Oscillator: Both %K and %D lines have been in the overbought zone for the last few days, suggesting a strong upward momentum.
Volatility Analysis:
- Bollinger Bands (BB): The stock price has been trading within the upper Bollinger Band for the past 5 days, indicating an overbought condition. However, the bands have not shown significant expansion, suggesting stable volatility.
- Bollinger %B (BBP): The %B has been consistently above 0.5, indicating an uptrend.
Volume Analysis:
- On-Balance Volume (OBV): The OBV has been trending upwards, indicating that buying volume has been higher than selling volume.
- Chaikin Money Flow (CMF): The CMF has been positive for the last 5 days, suggesting that money is flowing into the stock.
Key Observations:
- The stock is currently in a strong uptrend, supported by moving averages and MACD.
- Momentum indicators like RSI and Stochastic suggest overbought conditions, which could lead to a potential pullback.
- Volatility has been relatively stable, indicating a controlled price movement.
- Increasing OBV and positive CMF signal strong buying interest in the stock.
Conclusion:
Based on the technical indicators and analysis: - Short-Term: The stock is likely to experience a slight pullback or consolidation in the next few days due to overbought conditions indicated by RSI and Stochastic. - Medium-Term: The overall trend remains bullish, supported by moving averages and MACD. Therefore, the stock is expected to resume its upward movement after a brief consolidation. - Long-Term: With positive volume indicators and money flow, the stock has the potential to continue its upward trajectory in the long term.
Recommendation:
- Short-Term: Consider taking profits or waiting for a better entry point during the expected pullback.
- Medium to Long-Term: Hold or consider adding to positions on any dips to benefit from the overall bullish trend.
Key Words:
- Consolidation: Expected in the short term.
- Bullish: Overall trend remains positive.
- Pullback: Likely in the short term due to overbought conditions.
- Stable Volatility: Indicates controlled price movement.