Technical Analysis of HAPS 2024-05-10
Overview:
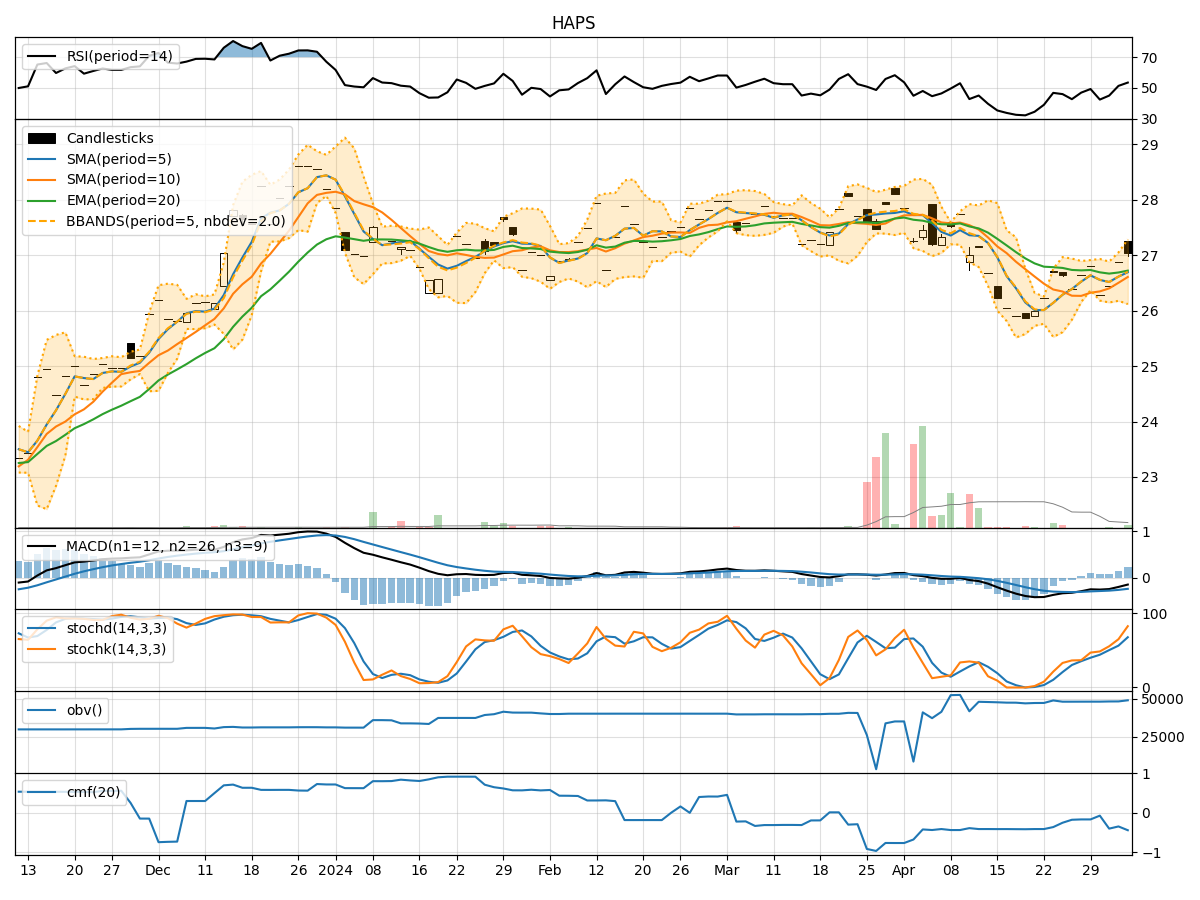
In analyzing the technical indicators for HAPS stock over the last 5 days, we will delve into the trend, momentum, volatility, and volume indicators to provide a comprehensive outlook on the possible stock price movement in the coming days. By examining key metrics such as moving averages, MACD, RSI, Bollinger Bands, and OBV, we aim to offer valuable insights and predictions for potential price trends.
Trend Indicators:
- Moving Averages (MA): The 5-day MA has been consistently above the closing prices, indicating a bullish trend.
- MACD: The MACD line has been above the signal line, suggesting a bullish momentum.
- EMA: The EMA has been trending upwards, supporting the bullish sentiment.
Key Observation: The trend indicators point towards an upward movement in the stock price.
Momentum Indicators:
- RSI: The RSI has been fluctuating around the overbought territory, indicating strong buying momentum.
- Stochastic Oscillator: Both %K and %D have been relatively high, signaling bullish momentum.
- Williams %R: The indicator has been hovering in the oversold region, suggesting a potential reversal.
Key Observation: Momentum indicators suggest a bullish sentiment in the market.
Volatility Indicators:
- Bollinger Bands: The stock price has been trading within the bands, indicating moderate volatility.
- Bollinger %B: The %B value has been fluctuating around the midline, suggesting a balanced market sentiment.
Key Observation: Volatility indicators imply a sideways movement in the stock price.
Volume Indicators:
- On-Balance Volume (OBV): The OBV has been relatively stable, indicating a neutral volume flow.
- Chaikin Money Flow (CMF): The CMF has been negative, suggesting a bearish money flow.
Key Observation: Volume indicators reflect a neutral to bearish volume sentiment.
Conclusion:
Based on the analysis of trend, momentum, volatility, and volume indicators, the overall outlook for HAPS stock in the next few days leans towards an upward movement. The bullish trend and momentum indicators, coupled with moderate volatility, indicate a potential price increase. However, the neutral to bearish volume sentiment warrants caution, as it may limit the extent of the price rise. Traders should closely monitor key levels and market developments to capitalize on potential opportunities while managing risks effectively.