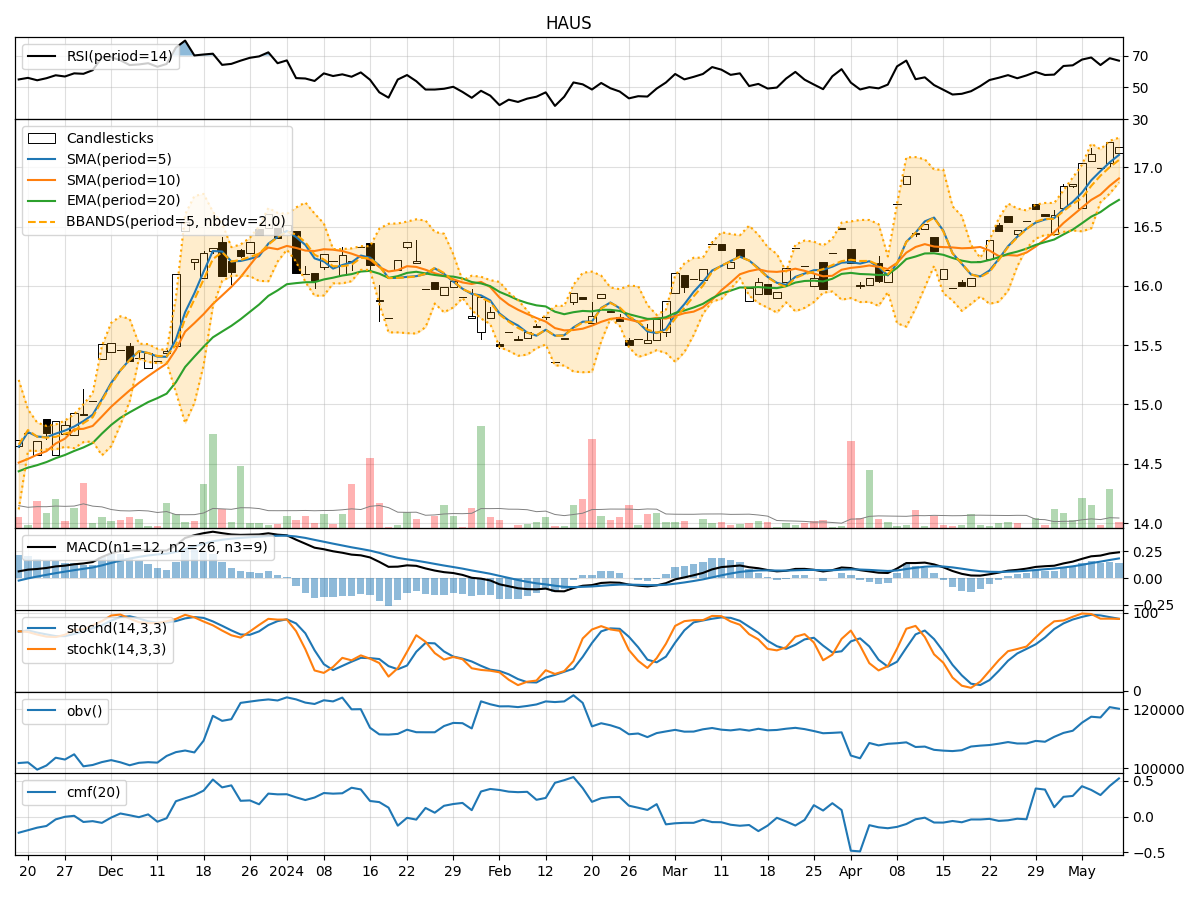
Technical Analysis of HAUS 2024-05-10
Overview:
In the last 5 trading days, HAUS stock has shown mixed signals across various technical indicators. The trend indicators suggest a slightly bullish sentiment, with moving averages trending upwards. Momentum indicators indicate a neutral to slightly bearish stance, while volatility indicators show a decreasing trend. Volume indicators also reflect a mixed sentiment. Based on these indicators, the next few days' possible stock price movement could be influenced by a combination of bullish and bearish factors.
Trend Indicators:
- Moving Averages (MA): The 5-day moving average (MA) has been consistently above the 10-day simple moving average (SMA), indicating a short-term bullish trend. The exponential moving average (EMA) has also been trending upwards, supporting a bullish sentiment.
- MACD: The MACD line has been above the signal line, suggesting a bullish momentum in the stock price.
Key Observation: The trend indicators point towards a bullish outlook for HAUS stock in the short term.
Momentum Indicators:
- RSI: The Relative Strength Index (RSI) has been fluctuating around the neutral level of 50, indicating a lack of strong momentum in either direction.
- Stochastic Oscillator: Both %K and %D have been fluctuating, showing indecision in the market.
- Williams %R: The Williams %R is hovering around the oversold territory, suggesting a potential reversal.
Key Observation: Momentum indicators suggest a neutral to slightly bearish sentiment for HAUS stock.
Volatility Indicators:
- Bollinger Bands (BB): The Bollinger Bands have been narrowing, indicating decreasing volatility in the stock price.
Key Observation: Volatility indicators signal a decreasing volatility trend for HAUS stock.
Volume Indicators:
- On-Balance Volume (OBV): The OBV has shown mixed signals, with some days recording negative values, indicating distribution.
- Chaikin Money Flow (CMF): The CMF has been fluctuating around the zero line, suggesting a balance between buying and selling pressure.
Key Observation: Volume indicators reflect a mixed sentiment in terms of buying and selling pressure.
Conclusion:
Based on the analysis of the technical indicators, the next few days' possible stock price movement for HAUS is likely to be sideways with a slight bullish bias. The trend indicators support a bullish outlook, while momentum indicators show a lack of strong directional momentum. Volatility is decreasing, indicating a potential consolidation phase. Volume indicators suggest a mixed sentiment, reflecting uncertainty in market participation.
Overall, the stock is expected to consolidate in the near term with a potential for a slight upward movement. Traders should closely monitor key support and resistance levels for potential entry and exit points.