Technical Analysis of HAUZ 2024-05-10
Overview:
In analyzing the technical indicators for HAUZ stock over the last 5 days, we will delve into the trend, momentum, volatility, and volume indicators to provide a comprehensive outlook on the possible stock price movement in the coming days. By examining these key factors, we aim to offer valuable insights and predictions to guide investment decisions.
Trend Analysis:
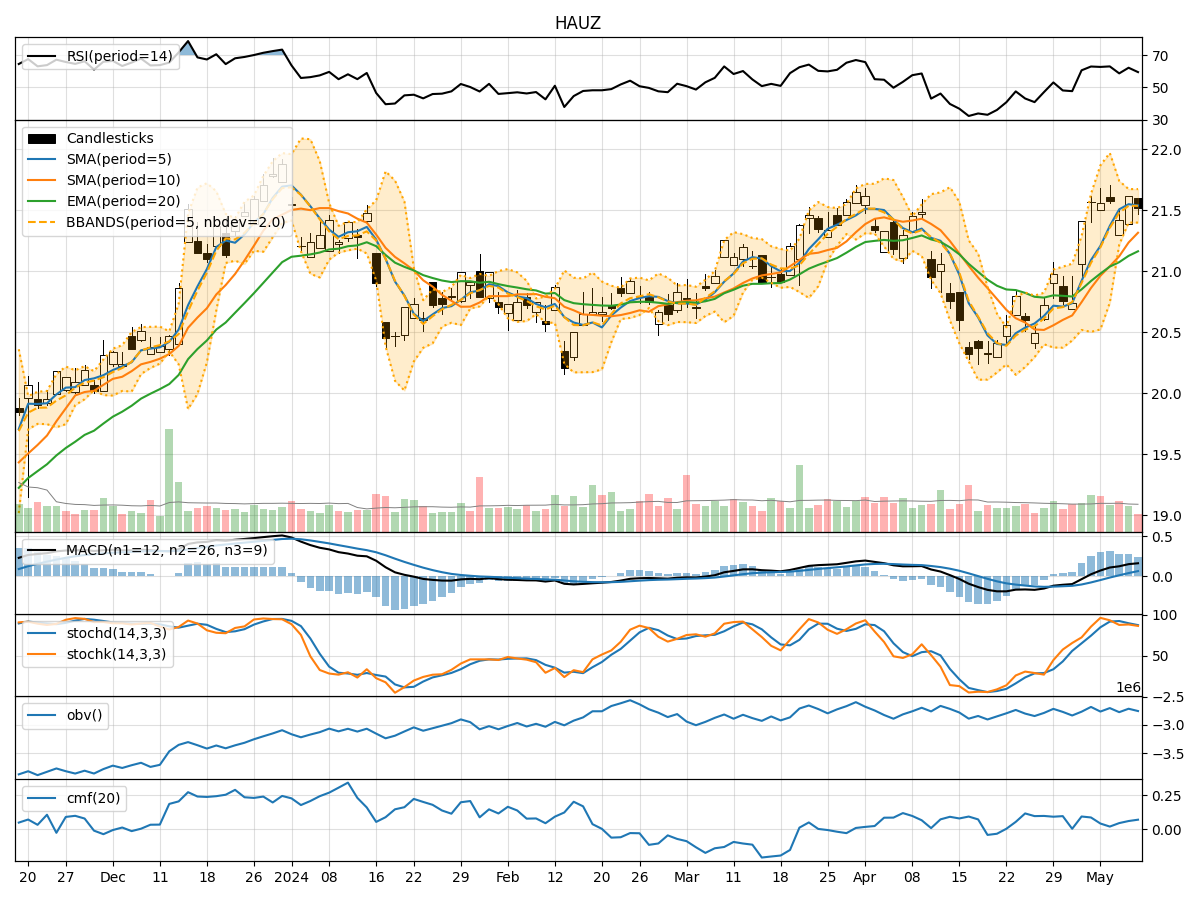
- Moving Averages (MA): The 5-day Moving Average (MA) has been consistently above the Simple Moving Average (SMA) and Exponential Moving Average (EMA), indicating a bullish trend.
- MACD: The MACD line has been above the signal line, with both showing an upward trend, suggesting bullish momentum.
- RSI: The Relative Strength Index (RSI) has been fluctuating around the 60-65 range, indicating a neutral to slightly bullish sentiment.
Momentum Analysis:
- Stochastic Oscillator: The Stochastic Oscillator has been hovering in the overbought territory, suggesting a potential reversal or consolidation.
- Williams %R: The Williams %R indicator has been fluctuating around the oversold region, indicating a mixed sentiment.
Volatility Analysis:
- Bollinger Bands: The Bollinger Bands have shown a narrowing of the bands, indicating decreasing volatility and a potential price breakout.
- Volatility Bands: The Volatility Bands have been relatively stable, suggesting a consolidation phase.
Volume Analysis:
- On-Balance Volume (OBV): The OBV indicator has shown a slight increase, indicating accumulation of the stock.
- Chaikin Money Flow (CMF): The CMF has been positive, reflecting buying pressure in the stock.
Key Observations:
- The trend indicators suggest a bullish sentiment with the MA, MACD, and RSI pointing towards upward momentum.
- Momentum indicators show a mixed sentiment with the Stochastic Oscillator in the overbought region and Williams %R fluctuating around oversold levels.
- Volatility indicators indicate a potential breakout as the Bollinger Bands narrow.
- Volume indicators reflect accumulation and buying pressure in the stock.
Conclusion:
Based on the analysis of the technical indicators, the overall outlook for HAUZ stock in the next few days is bullish. The trend indicators support a continuation of the upward momentum, while volatility suggests a potential breakout. However, caution is advised as momentum indicators show signs of potential reversal or consolidation. Investors should closely monitor the price action and key support/resistance levels for confirmation of the bullish trend.