Technical Analysis of HCOM 2024-05-10
Overview:
In analyzing the technical indicators for HCOM over the last 5 days, we will delve into the trend, momentum, volatility, and volume indicators to provide a comprehensive outlook on the possible stock price movement in the coming days. By examining these key indicators, we aim to offer valuable insights and predictions to guide your investment decisions.
Trend Analysis:
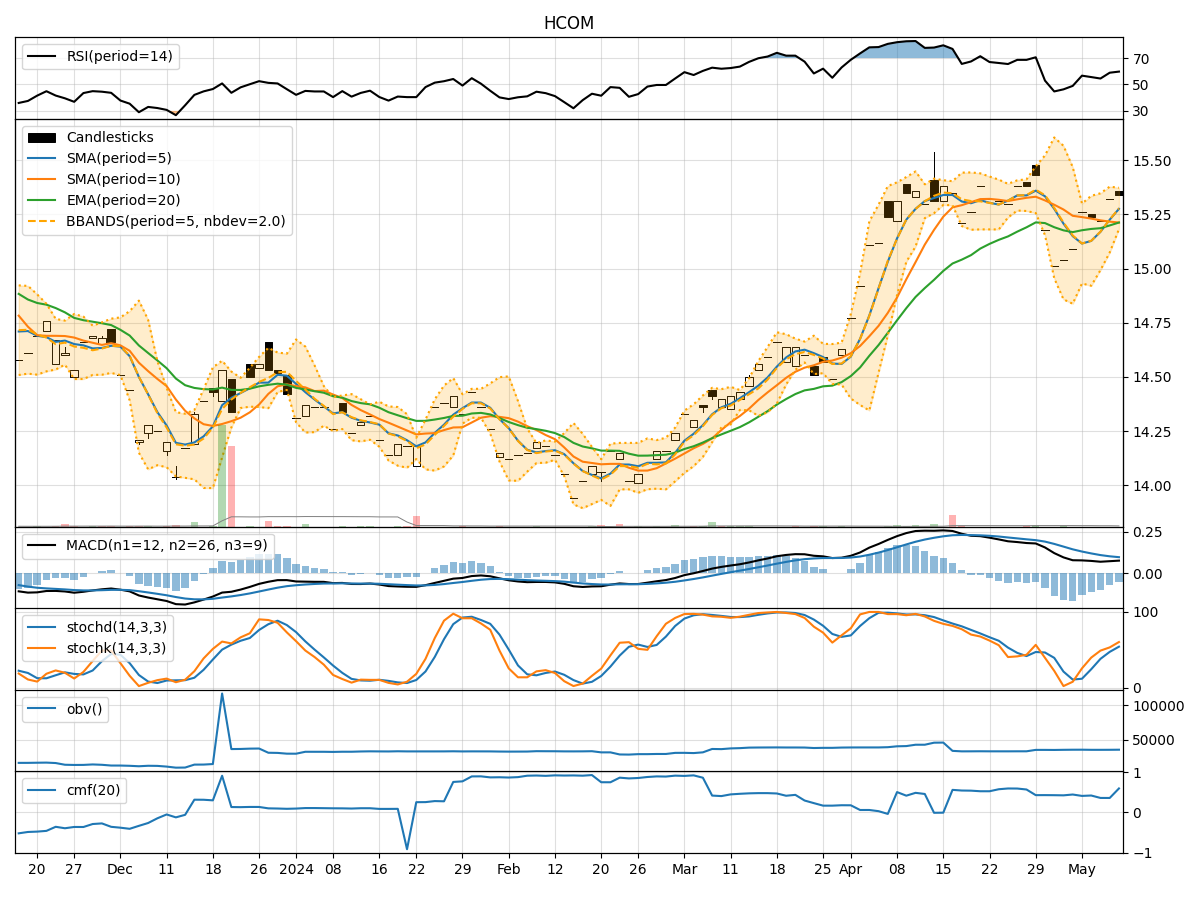
- Moving Averages (MA): The 5-day Moving Average (MA) has been consistently above the Simple Moving Average (SMA) and Exponential Moving Average (EMA), indicating a short-term uptrend.
- MACD: The MACD line has been positive, staying above the signal line, suggesting bullish momentum.
- RSI: The Relative Strength Index (RSI) has been fluctuating around the neutral zone, indicating a balanced market sentiment.
Momentum Analysis:
- Stochastic Oscillator: Both %K and %D have been trending upwards, reflecting increasing buying pressure.
- Williams %R: The indicator has been hovering in the oversold territory, suggesting a potential reversal in the near term.
Volatility Analysis:
- Bollinger Bands (BB): The stock price has been trading within the bands, indicating a period of consolidation.
- BB Width: The narrowing of the bands suggests decreasing volatility and a possible breakout in the future.
Volume Analysis:
- On-Balance Volume (OBV): The OBV has shown a slight increase, indicating accumulation by investors.
- Chaikin Money Flow (CMF): The CMF has been positive, signaling buying pressure in the market.
Key Observations:
- The trend indicators point towards a bullish sentiment in the short term.
- Momentum indicators suggest a potential uptrend continuation.
- Volatility indicators indicate a period of consolidation with a potential breakout.
- Volume indicators show a slight increase in buying pressure.
Conclusion:
Based on the analysis of the technical indicators, the overall outlook for HCOM in the next few days is bullish. The stock is likely to experience an upward movement, supported by the positive trend and momentum signals. Traders may consider entering long positions to capitalize on the expected price appreciation. However, it is essential to monitor key levels and set stop-loss orders to manage risk effectively.