Technical Analysis of HCOW 2024-05-10
Overview:
In analyzing the technical indicators for HCOW over the last 5 days, we will delve into the trend, momentum, volatility, and volume indicators to provide a comprehensive assessment of the stock's potential price movement. By examining these key factors, we aim to offer valuable insights and predictions for the next few days.
Trend Analysis:
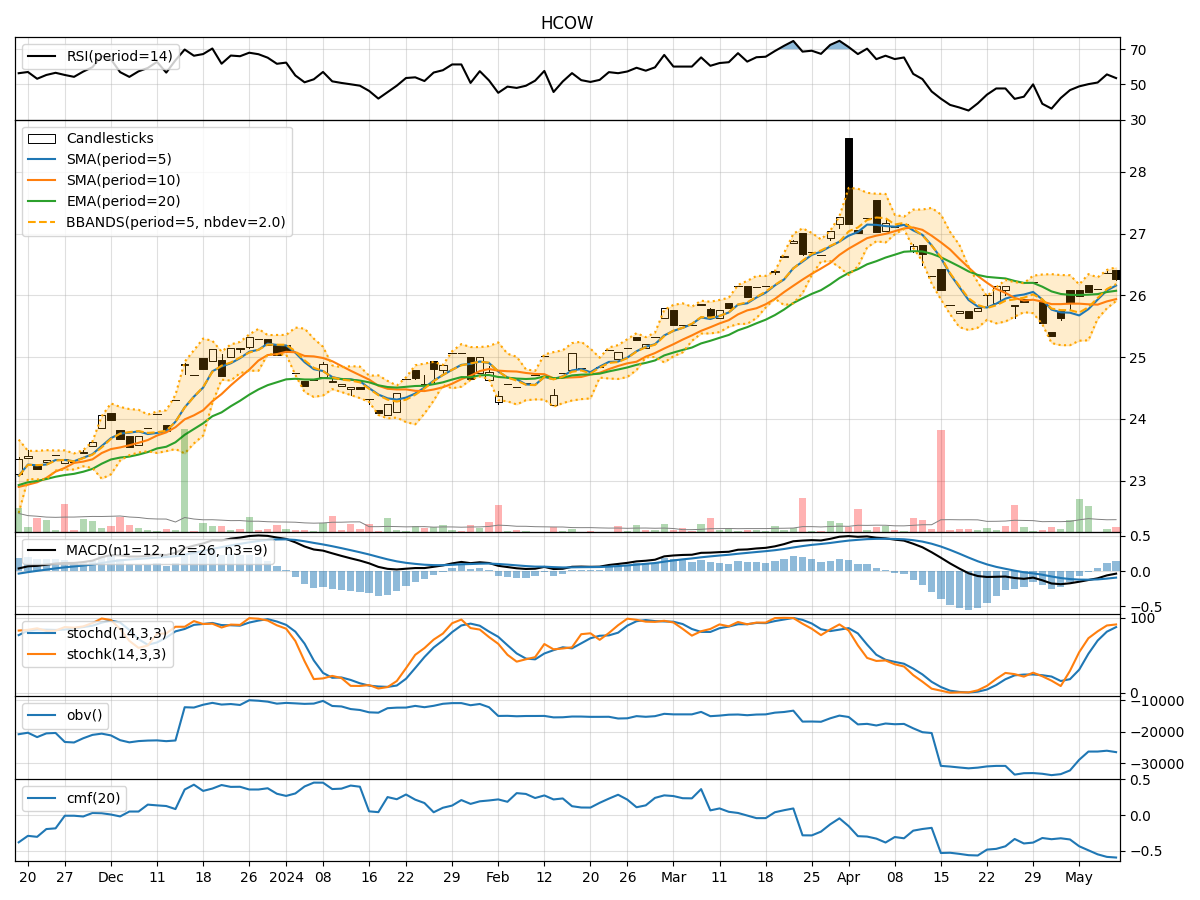
- Moving Averages (MA): The 5-day Moving Average (MA) has been consistently above the Simple Moving Average (SMA) and Exponential Moving Average (EMA), indicating a short-term uptrend.
- MACD: The Moving Average Convergence Divergence (MACD) has been negative but showing signs of convergence towards the signal line, suggesting a potential reversal in the trend.
Momentum Analysis:
- RSI: The Relative Strength Index (RSI) has been fluctuating around the neutral zone, indicating indecision in the market.
- Stochastic Oscillator: Both %K and %D have been in the overbought territory, signaling a potential reversal or consolidation.
Volatility Analysis:
- Bollinger Bands (BB): The stock price has been trading within the Bollinger Bands, with the bands narrowing, indicating decreasing volatility.
- Bollinger %B: The %B indicator has been hovering around 0.7, suggesting the stock is trading closer to the upper band.
Volume Analysis:
- On-Balance Volume (OBV): The OBV has been fluctuating, indicating mixed buying and selling pressure.
- Chaikin Money Flow (CMF): The CMF has been negative, reflecting outflow of money from the stock.
Key Observations:
- The trend indicators suggest a potential reversal in the short-term uptrend.
- Momentum indicators show indecision in the market with a possibility of a reversal.
- Volatility is decreasing, indicating a potential period of consolidation.
- Volume indicators reflect mixed buying and selling pressure with a negative money flow.
Conclusion:
Based on the analysis of the technical indicators, the next few days for HCOW are likely to see sideways movement with a potential for consolidation. The stock may trade within a narrow range as it seeks direction amidst mixed signals from the indicators. Traders should exercise caution and wait for clearer signals before making significant trading decisions.