Technical Analysis of HDEF 2024-05-10
Overview:
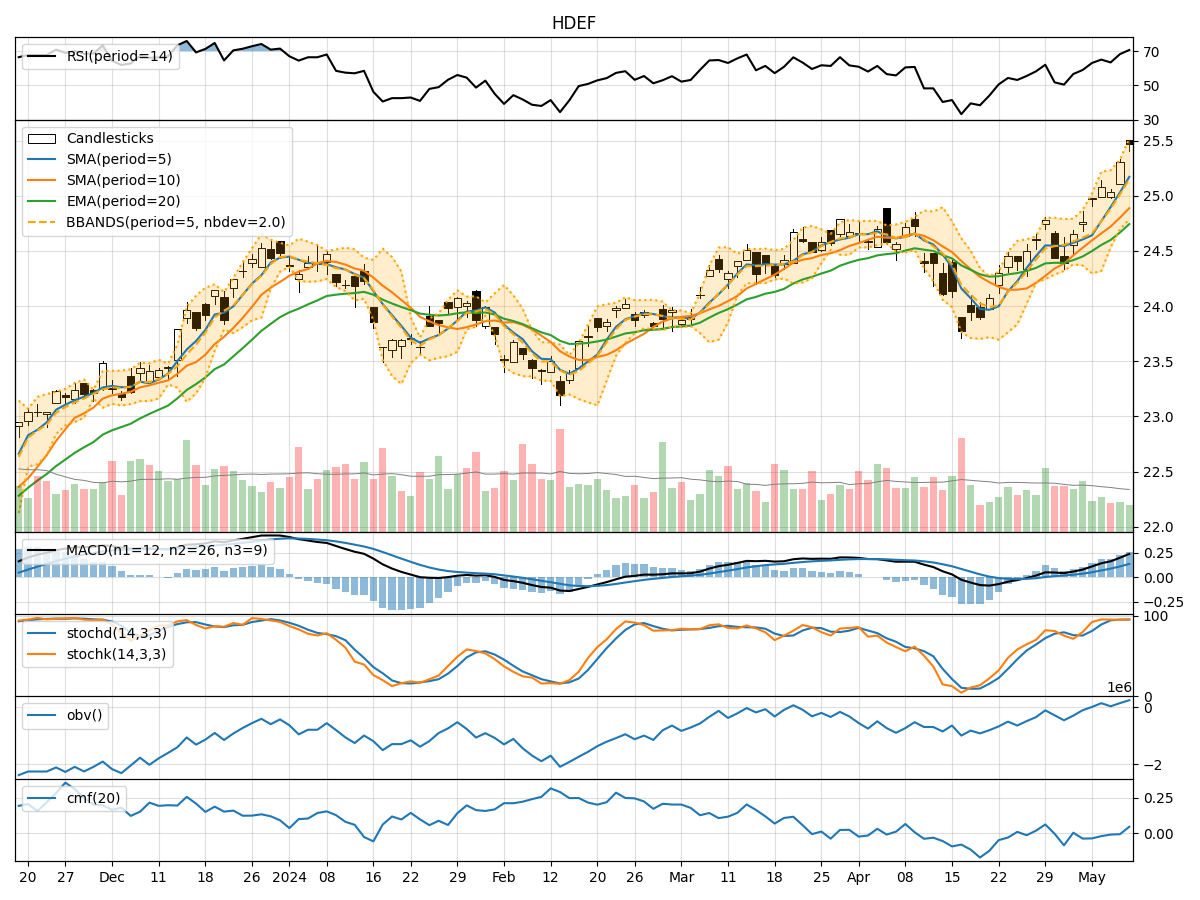
In the last 5 trading days, HDEF stock has shown a consistent uptrend in its price movement. The moving averages have been trending upwards, indicating a positive momentum. The MACD and RSI are also showing bullish signals. However, the stock is currently trading near its upper Bollinger Band, suggesting a potential overbought condition. Let's delve deeper into each category of technical indicators to provide a comprehensive analysis and make a prediction for the next few days.
Trend Indicators:
- Moving Averages (MA): The 5-day MA has been consistently above the longer-term SMAs, indicating a strong bullish trend.
- MACD: The MACD line has been above the signal line for the past 5 days, confirming a bullish momentum.
- Conclusion: The trend indicators suggest a strong upward momentum in the stock price.
Momentum Indicators:
- RSI: The RSI has been consistently above 50 and is trending upwards, indicating increasing buying pressure.
- Stochastic Oscillator: Both %K and %D lines are in the overbought zone, suggesting a potential reversal or consolidation.
- Conclusion: Momentum indicators signal a bullish sentiment but also hint at a possible overbought condition.
Volatility Indicators:
- Bollinger Bands (BB): The stock price is currently near the upper Bollinger Band, indicating a higher likelihood of a pullback or consolidation.
- Conclusion: Volatility indicators suggest a potential consolidation or pullback in the stock price.
Volume Indicators:
- On-Balance Volume (OBV): The OBV has been increasing over the past 5 days, indicating strong buying volume.
- Chaikin Money Flow (CMF): The CMF is negative but has been improving, suggesting a potential shift towards buying pressure.
- Conclusion: Volume indicators point towards increased buying volume but also highlight some selling pressure.
Overall Conclusion:
Based on the analysis of trend, momentum, volatility, and volume indicators, the next few days' possible stock price movement for HDEF is likely to experience a short-term consolidation or pullback. While the overall trend remains bullish, the overbought conditions indicated by the Stochastic Oscillator and the proximity to the upper Bollinger Band suggest a potential pause in the upward movement. Traders may consider taking profits or waiting for a better entry point before considering long positions. It is essential to monitor the price action closely for any signs of a reversal or continuation of the current uptrend.