Technical Analysis of HDG 2024-05-10
Overview:
In analyzing the technical indicators for HDG stock over the last 5 days, we will delve into the trend, momentum, volatility, and volume indicators to provide a comprehensive outlook on the possible future stock price movement. By examining these key indicators, we aim to offer valuable insights and predictions for the upcoming trading days.
Trend Analysis:
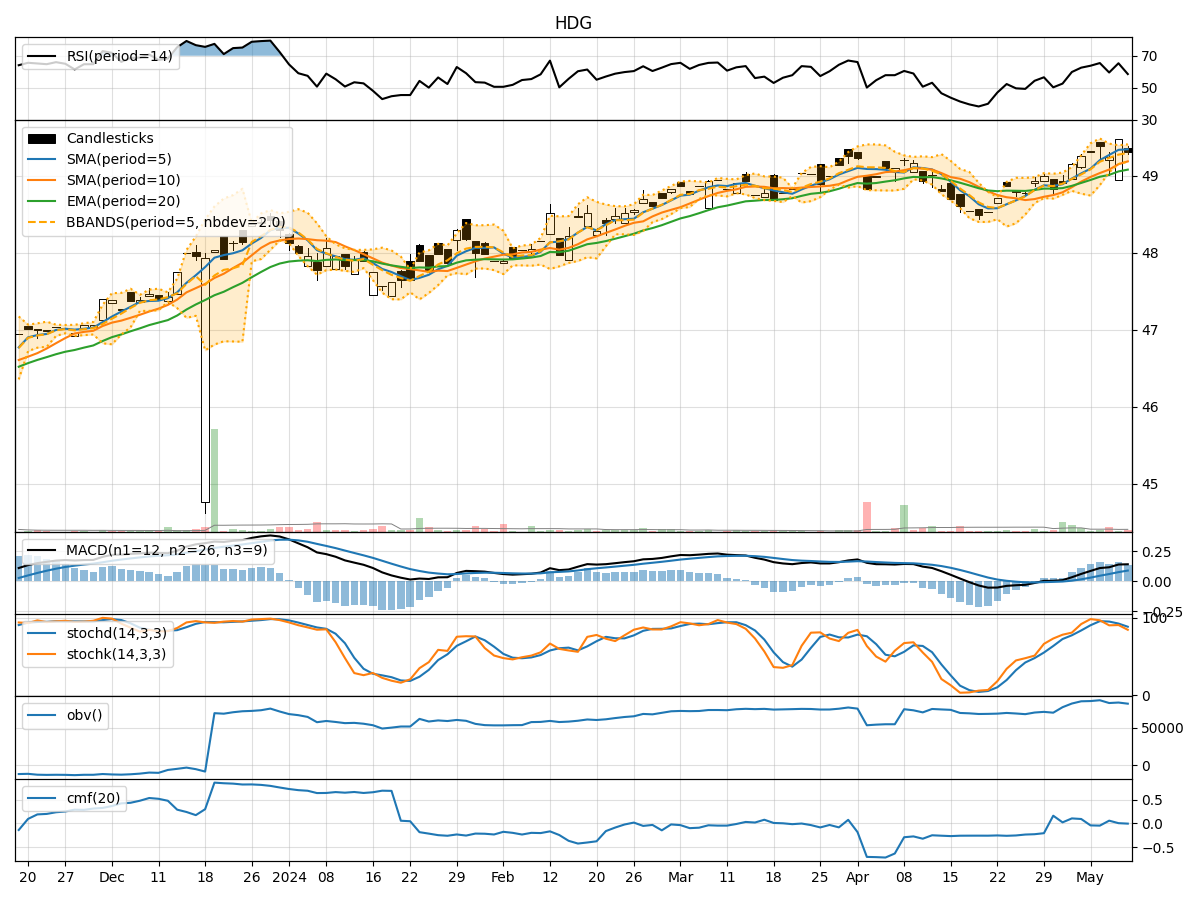
- Moving Averages (MA): The 5-day Moving Average (MA) has been consistently above the Simple Moving Average (SMA) and Exponential Moving Average (EMA), indicating a bullish trend.
- MACD: The MACD line has been consistently above the signal line, with both lines showing an upward trend, suggesting bullish momentum.
Momentum Analysis:
- RSI: The Relative Strength Index (RSI) has been fluctuating in the overbought territory, indicating strong buying pressure.
- Stochastic Oscillator: Both %K and %D lines have been in the overbought zone, suggesting a potential reversal or consolidation.
Volatility Analysis:
- Bollinger Bands (BB): The stock price has been trading within the Bollinger Bands, with the bands narrowing, indicating decreasing volatility.
Volume Analysis:
- On-Balance Volume (OBV): The OBV has shown mixed movements, indicating indecision among investors.
- Chaikin Money Flow (CMF): The CMF has been fluctuating around the zero line, suggesting a balance between buying and selling pressure.
Key Observations:
- The trend indicators suggest a strong bullish sentiment in the short term.
- Momentum indicators show potential overbought conditions, signaling a need for caution.
- Volatility has been decreasing, indicating a possible period of consolidation.
- Volume indicators reflect mixed investor sentiment, with no clear direction.
Conclusion:
Based on the analysis of the technical indicators, the stock is likely to experience a short-term upward movement due to the bullish trend and momentum. However, the overbought conditions and mixed volume signals suggest a potential for consolidation or a minor pullback in the near future. Traders should closely monitor the stochastic oscillator for signs of a reversal and exercise caution in their trading decisions.