Technical Analysis of HDGE 2024-05-10
Overview:
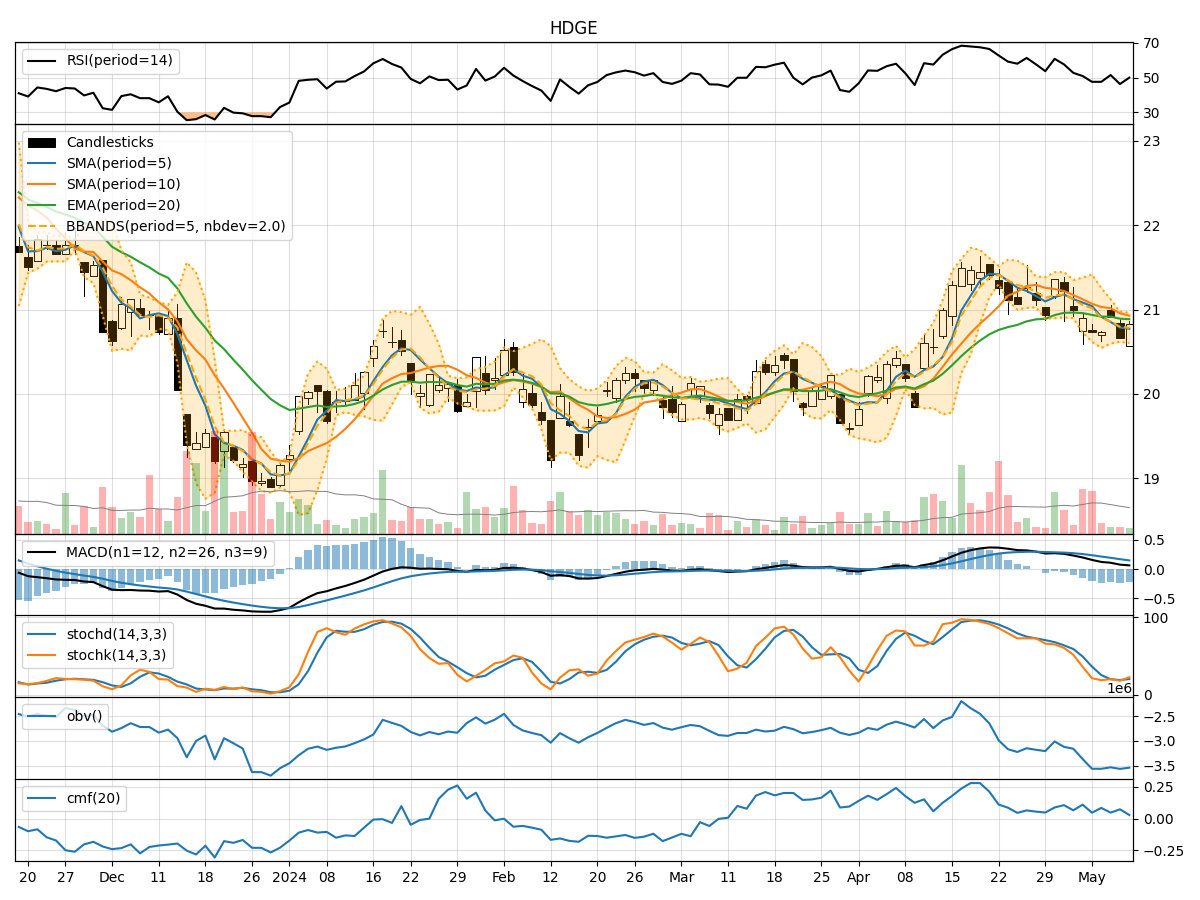
In analyzing the technical indicators for HDGE over the last 5 days, we will delve into the trend, momentum, volatility, and volume indicators to provide a comprehensive outlook on the possible stock price movement in the coming days. By examining these key aspects, we aim to offer valuable insights and predictions for informed decision-making.
Trend Analysis:
- Moving Averages (MA): The 5-day Moving Average (MA) has been consistently below the Simple Moving Average (SMA) and Exponential Moving Average (EMA) over the past 5 days, indicating a downward trend in the stock price.
- MACD: The Moving Average Convergence Divergence (MACD) has shown a positive trend, with the MACD line consistently above the Signal line, suggesting bullish momentum in the short term.
Momentum Analysis:
- RSI: The Relative Strength Index (RSI) has been fluctuating around the 50 level, indicating neutral momentum in the stock.
- Stochastic Oscillator: Both %K and %D lines of the Stochastic Oscillator have been hovering in the oversold region, suggesting a potential reversal in the stock price.
Volatility Analysis:
- Bollinger Bands: The Bollinger Bands have been narrowing, indicating decreasing volatility in the stock price.
- Bollinger %B: The %B indicator has been fluctuating around the midline, suggesting sideways movement in the stock price.
Volume Analysis:
- On-Balance Volume (OBV): The OBV indicator has shown a slight decrease over the last 5 days, indicating selling pressure in the stock.
- Chaikin Money Flow (CMF): The CMF has been positive but trending downwards, suggesting weakening buying pressure.
Conclusion:
Based on the analysis of the technical indicators, the stock of HDGE is likely to experience further downward movement in the coming days. The trend indicators point towards a bearish sentiment, supported by the decreasing OBV and weakening CMF. While the MACD shows short-term bullish momentum, the overall picture painted by the momentum and volume indicators suggests a more cautious approach.
Considering the narrowing Bollinger Bands and sideways movement indicated by %B, we may see the stock price consolidate in the near term before potentially resuming its downward trajectory. Traders and investors should exercise caution and consider waiting for more definitive signals before making any significant trading decisions.
Key Conclusion:
The overall outlook for HDGE in the next few days is bearish, with a potential for further downside movement. Traders should closely monitor key support levels and wait for confirmation from multiple indicators before considering any entry or exit positions.