Technical Analysis of HDLB 2024-05-10
Overview:
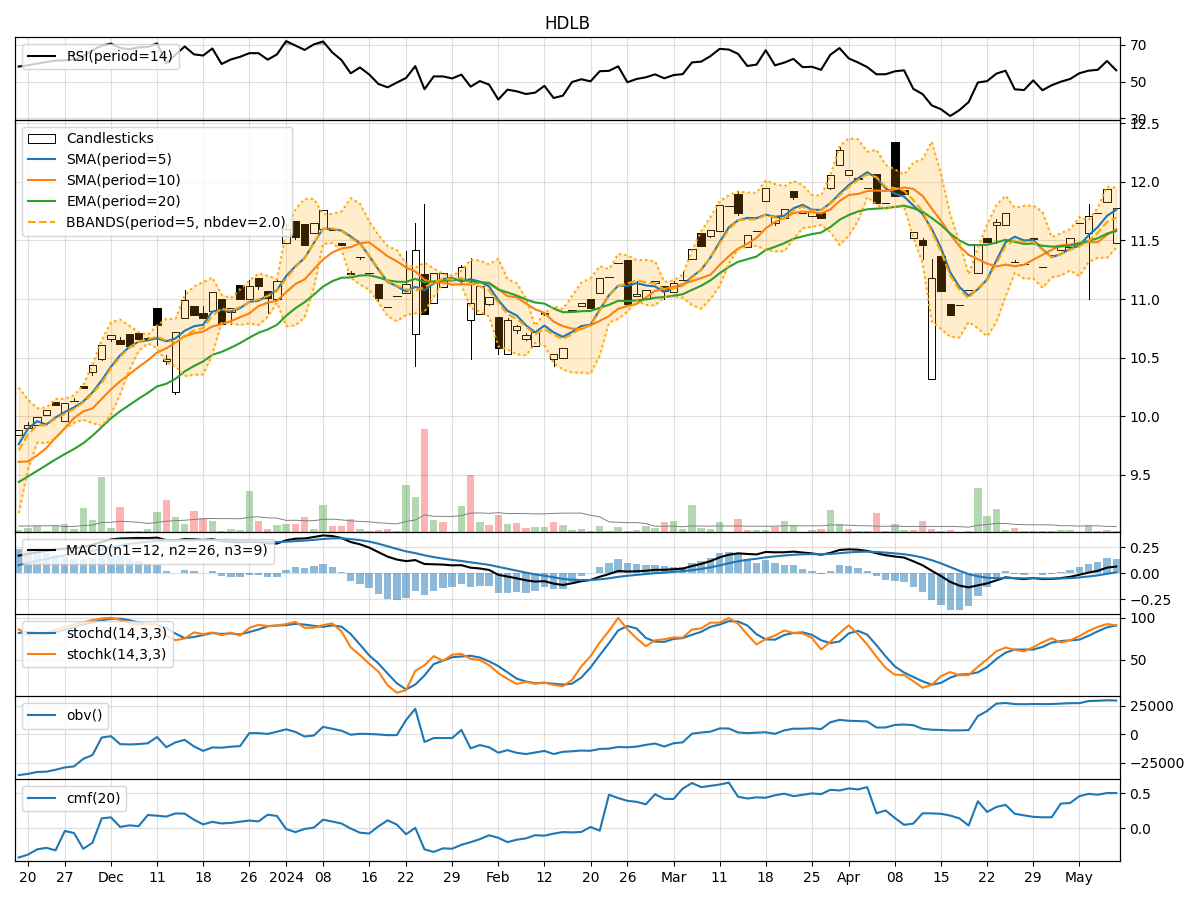
In analyzing the technical indicators for HDLB over the last 5 days, we will delve into the trend, momentum, volatility, and volume indicators to provide a comprehensive outlook on the possible stock price movement in the coming days.
Trend Analysis:
- Moving Averages (MA): The 5-day Moving Average (MA) has been consistently rising, indicating a bullish trend in the short term.
- MACD: The MACD line has been above the signal line, with both lines showing an upward trend, suggesting bullish momentum.
- EMA: The Exponential Moving Average (EMA) has also been trending upwards, supporting the bullish sentiment.
Momentum Analysis:
- RSI: The Relative Strength Index (RSI) has been fluctuating around the 60-70 range, indicating a neutral to slightly bullish momentum.
- Stochastic Oscillator: Both %K and %D have been in the overbought territory, suggesting a potential reversal or consolidation.
- Williams %R: The Williams %R is hovering around the oversold region, indicating a potential buying opportunity.
Volatility Analysis:
- Bollinger Bands: The stock price has been trading within the Bollinger Bands, with the bands widening slightly, indicating increased volatility.
- Bollinger %B: The %B indicator is below 1, suggesting that the stock price is trading below the upper band, potentially signaling a buying opportunity.
Volume Analysis:
- On-Balance Volume (OBV): The OBV has been trending upwards, indicating accumulation by investors.
- Chaikin Money Flow (CMF): The CMF has been positive, suggesting that money is flowing into the stock.
Key Observations:
- The trend indicators point towards a bullish sentiment in the short term.
- Momentum indicators show a mixed signal, with RSI neutral, Stochastic overbought, and Williams %R oversold.
- Volatility has increased slightly, indicating potential price swings.
- Volume indicators suggest accumulation and positive money flow into the stock.
Conclusion:
Based on the analysis of the technical indicators, the overall outlook for HDLB in the next few days is bullish. The trend indicators support a continued upward movement, while momentum indicators show a mixed signal that may lead to some consolidation or a minor pullback before resuming the uptrend. The increase in volatility suggests potential price swings, and the positive volume indicators indicate investor interest in the stock. Therefore, it is likely that HDLB will experience upward price movement in the coming days, with potential short-term fluctuations due to mixed momentum signals.