Technical Analysis of HDMV 2024-05-10
Overview:
In analyzing the technical indicators for HDMV stock over the last 5 days, we will delve into the trend, momentum, volatility, and volume indicators to provide a comprehensive outlook on the possible future stock price movement. By examining these key indicators, we aim to offer valuable insights and predictions for the upcoming trading days.
Trend Analysis:
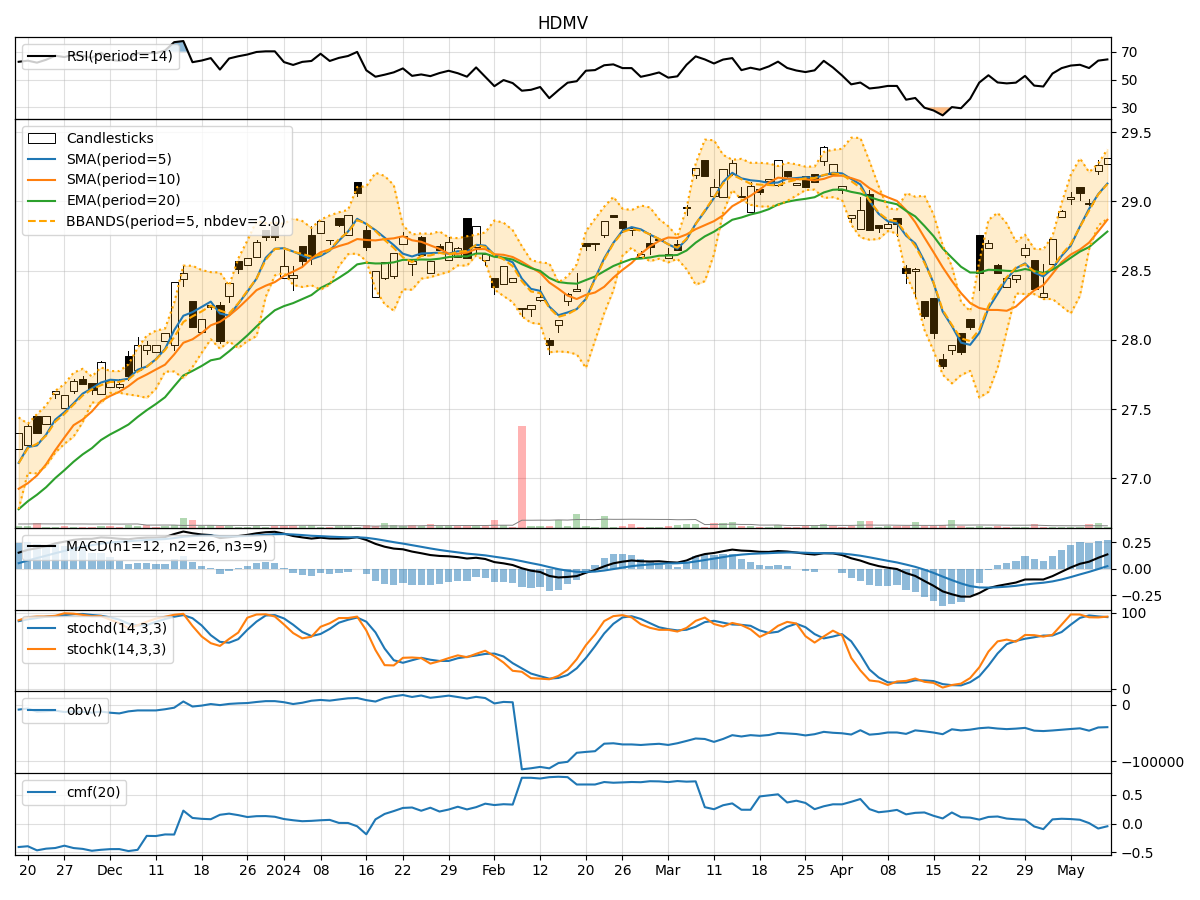
- Moving Averages (MA): The 5-day Moving Average (MA) has been consistently above the Simple Moving Average (SMA) and Exponential Moving Average (EMA), indicating a bullish trend.
- MACD: The MACD line has been consistently above the signal line, with both lines showing an upward trend, suggesting bullish momentum.
- RSI: The Relative Strength Index (RSI) has been fluctuating around the 60-65 range, indicating a neutral to slightly bullish sentiment.
Momentum Analysis:
- Stochastic Oscillator: The Stochastic Oscillator has been hovering in the overbought territory, suggesting a potential reversal or consolidation.
- Williams %R: The Williams %R indicator has been fluctuating around the oversold territory, indicating a mixed sentiment.
Volatility Analysis:
- Bollinger Bands (BB): The stock price has been trading within the Bollinger Bands, with the bands narrowing, indicating decreasing volatility.
- Average True Range (ATR): The ATR has shown a decrease in volatility over the last few days.
Volume Analysis:
- On-Balance Volume (OBV): The OBV indicator has been relatively stable, suggesting a balance between buying and selling pressure.
- Chaikin Money Flow (CMF): The CMF has been negative, indicating a slight outflow of money from the stock.
Conclusion:
Based on the analysis of the technical indicators, the stock is currently in a bullish trend with strong momentum. However, the overbought conditions in the Stochastic Oscillator and the mixed sentiment in the Williams %R suggest a possible consolidation or pullback in the near term. The narrowing Bollinger Bands and decreasing volatility also support the view of a potential consolidation phase.
Therefore, the next few days may see the stock price experiencing a sideways movement or a slight correction before potentially resuming its upward trajectory. Traders should closely monitor key support and resistance levels for potential entry or exit points in line with the overall bullish trend.